Workflow Solutions for Operations & Asset Management

Workflow Solutions for Operations & Asset Management
No production and baffled why? That is no more.
birdy7’s tools for Reporting and Asset Management lets your Operations and Asset Management teams become proactive, instead of reactive.
Diagnostics. Dig deeper to see the light.
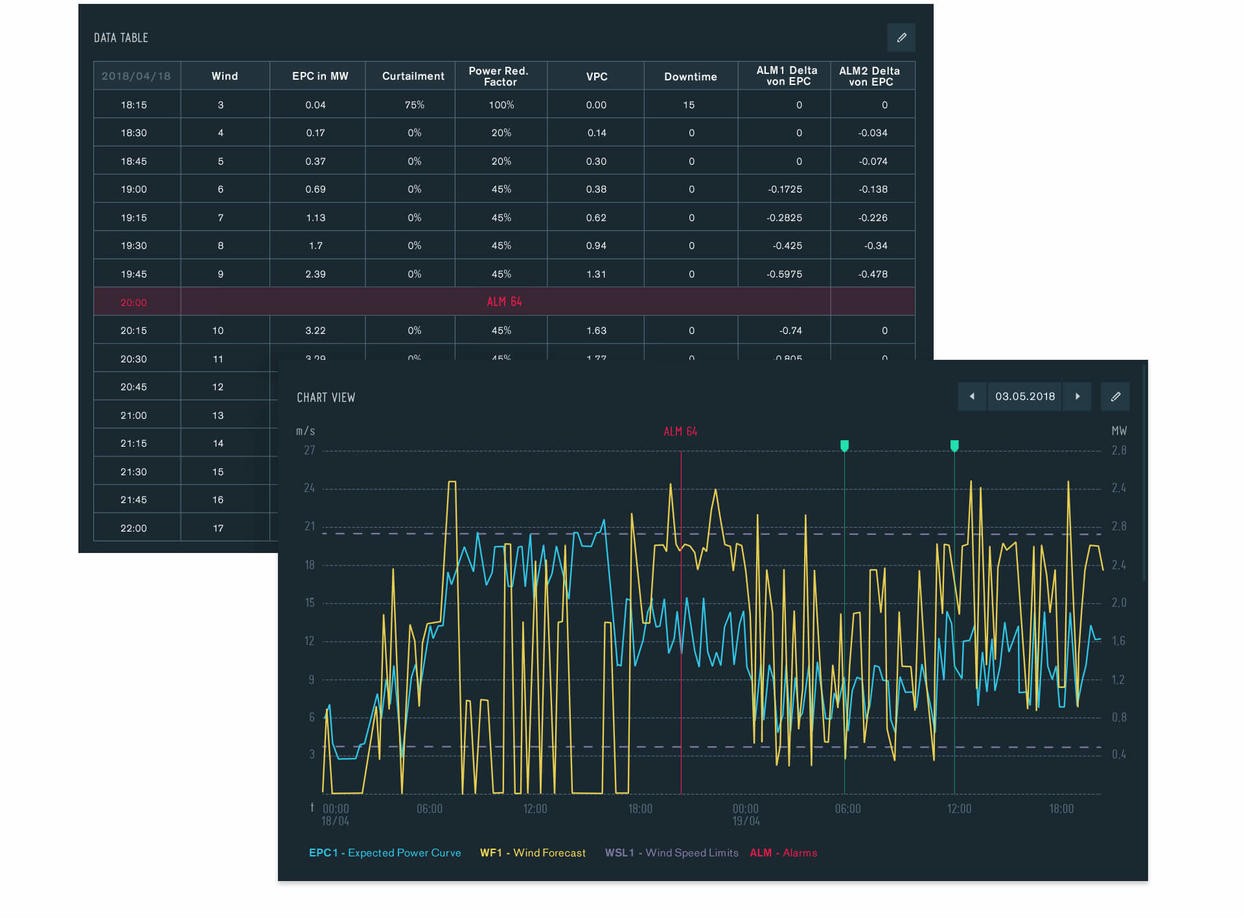
Modern renewable-energy power plants collect massive amounts of data. With the integrated Business Intelligence (BI) of birdy7 you can now use them sensibly: You can create your own analyzes or simply run existing ones. You not only determine which information should be processed, but also how and in which output format. With our Script and Chart Engine you bring your own business analytics into the power plant or your fleet.
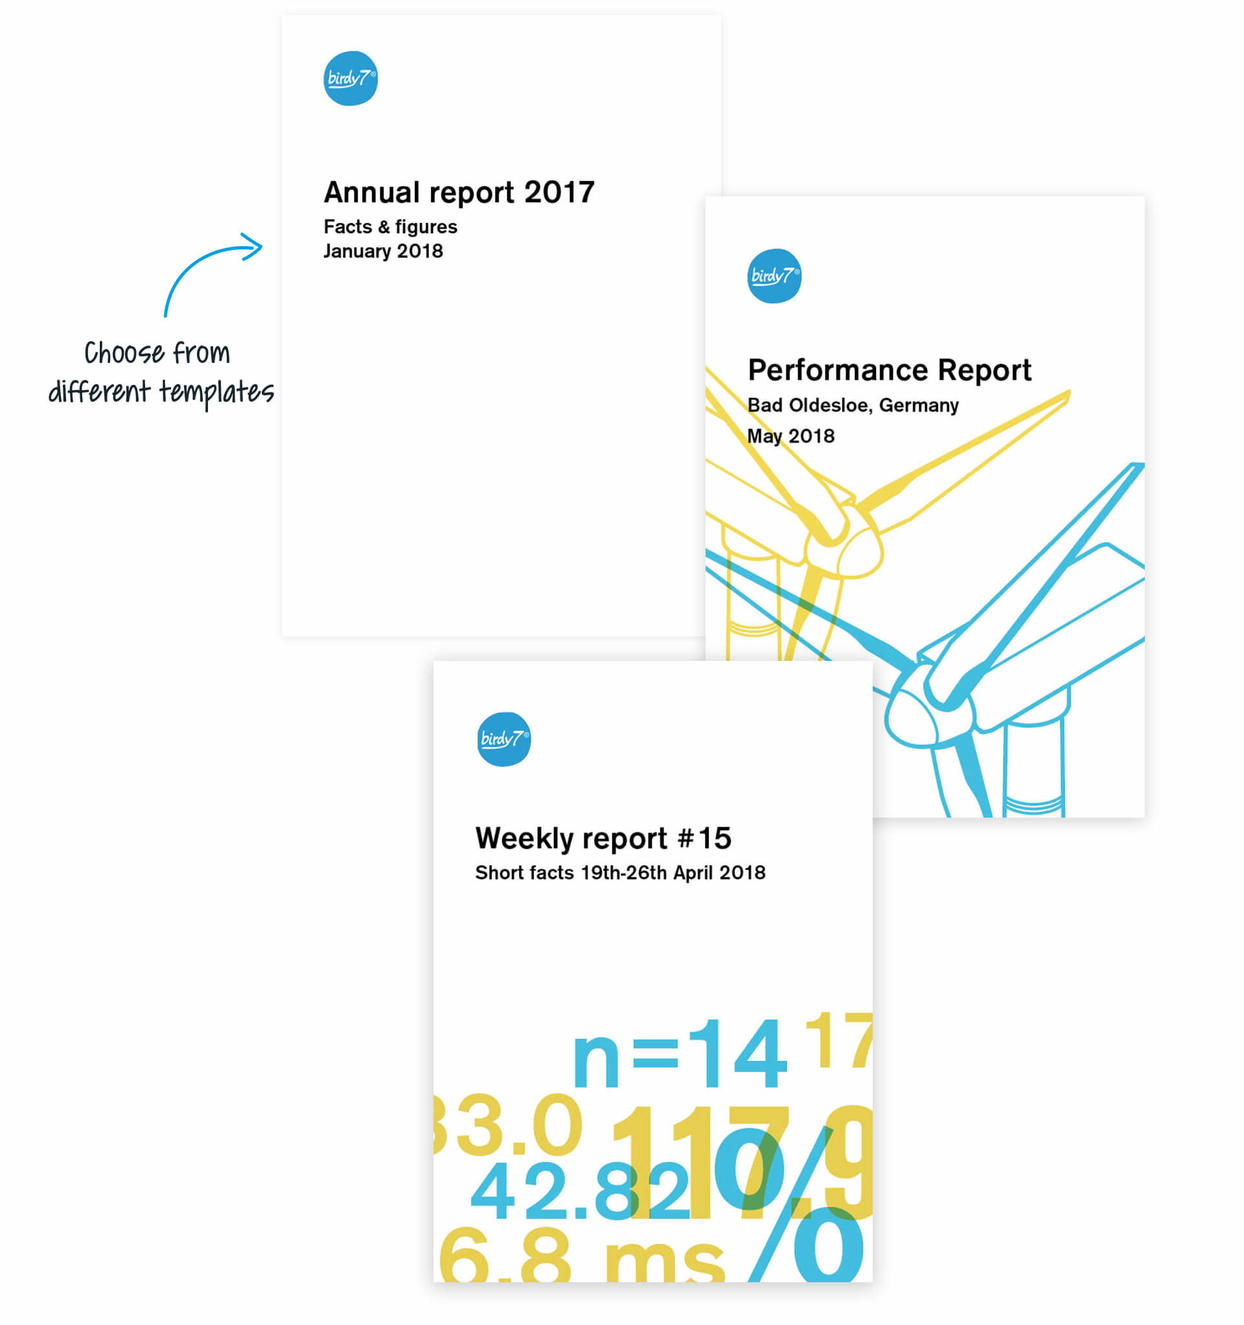
Flexible & fast reports
With Birdy7's Reporting Engine, you can quickly and flexibly create reports based on previously created report templates. To create your custom report templates, use Jaspersoft Studio.
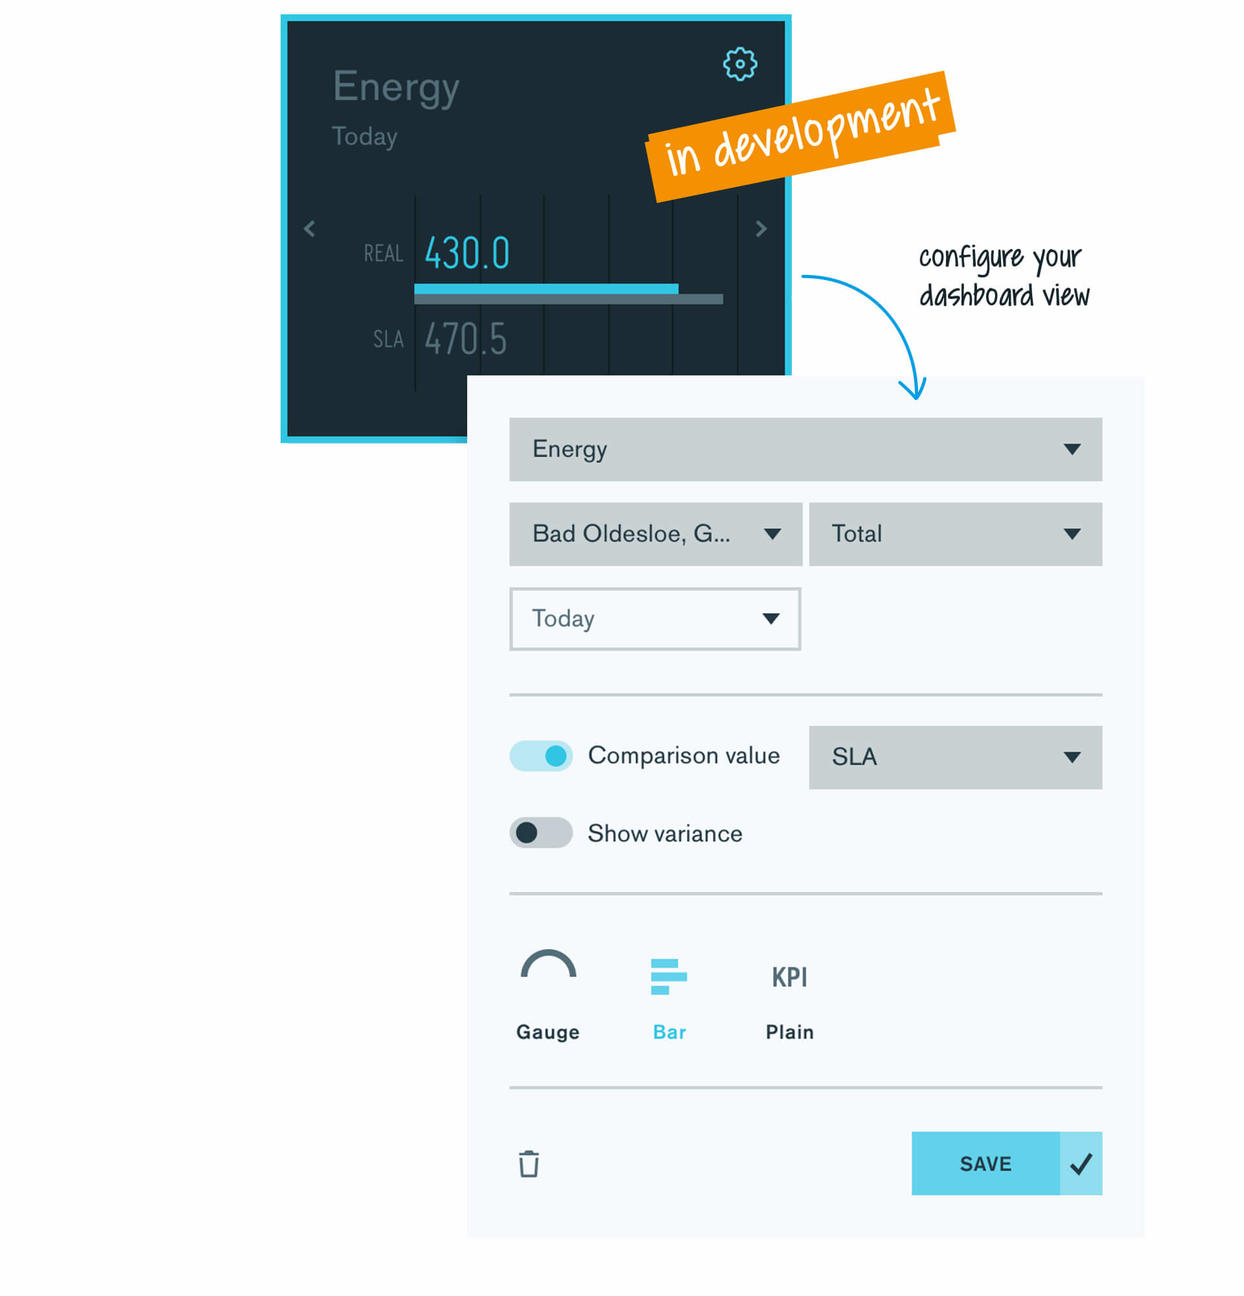
Visual data analysis using your dashboard.
Our Dashboard design presents the key information to you in a simple way, empowering you to maintain a keen awareness of the current situation. It is also the starting point for your analyses. The data you deem important are displayed on your birdy7 Dashboard which you can freely configure. Or, simply use one of our templates to get started.
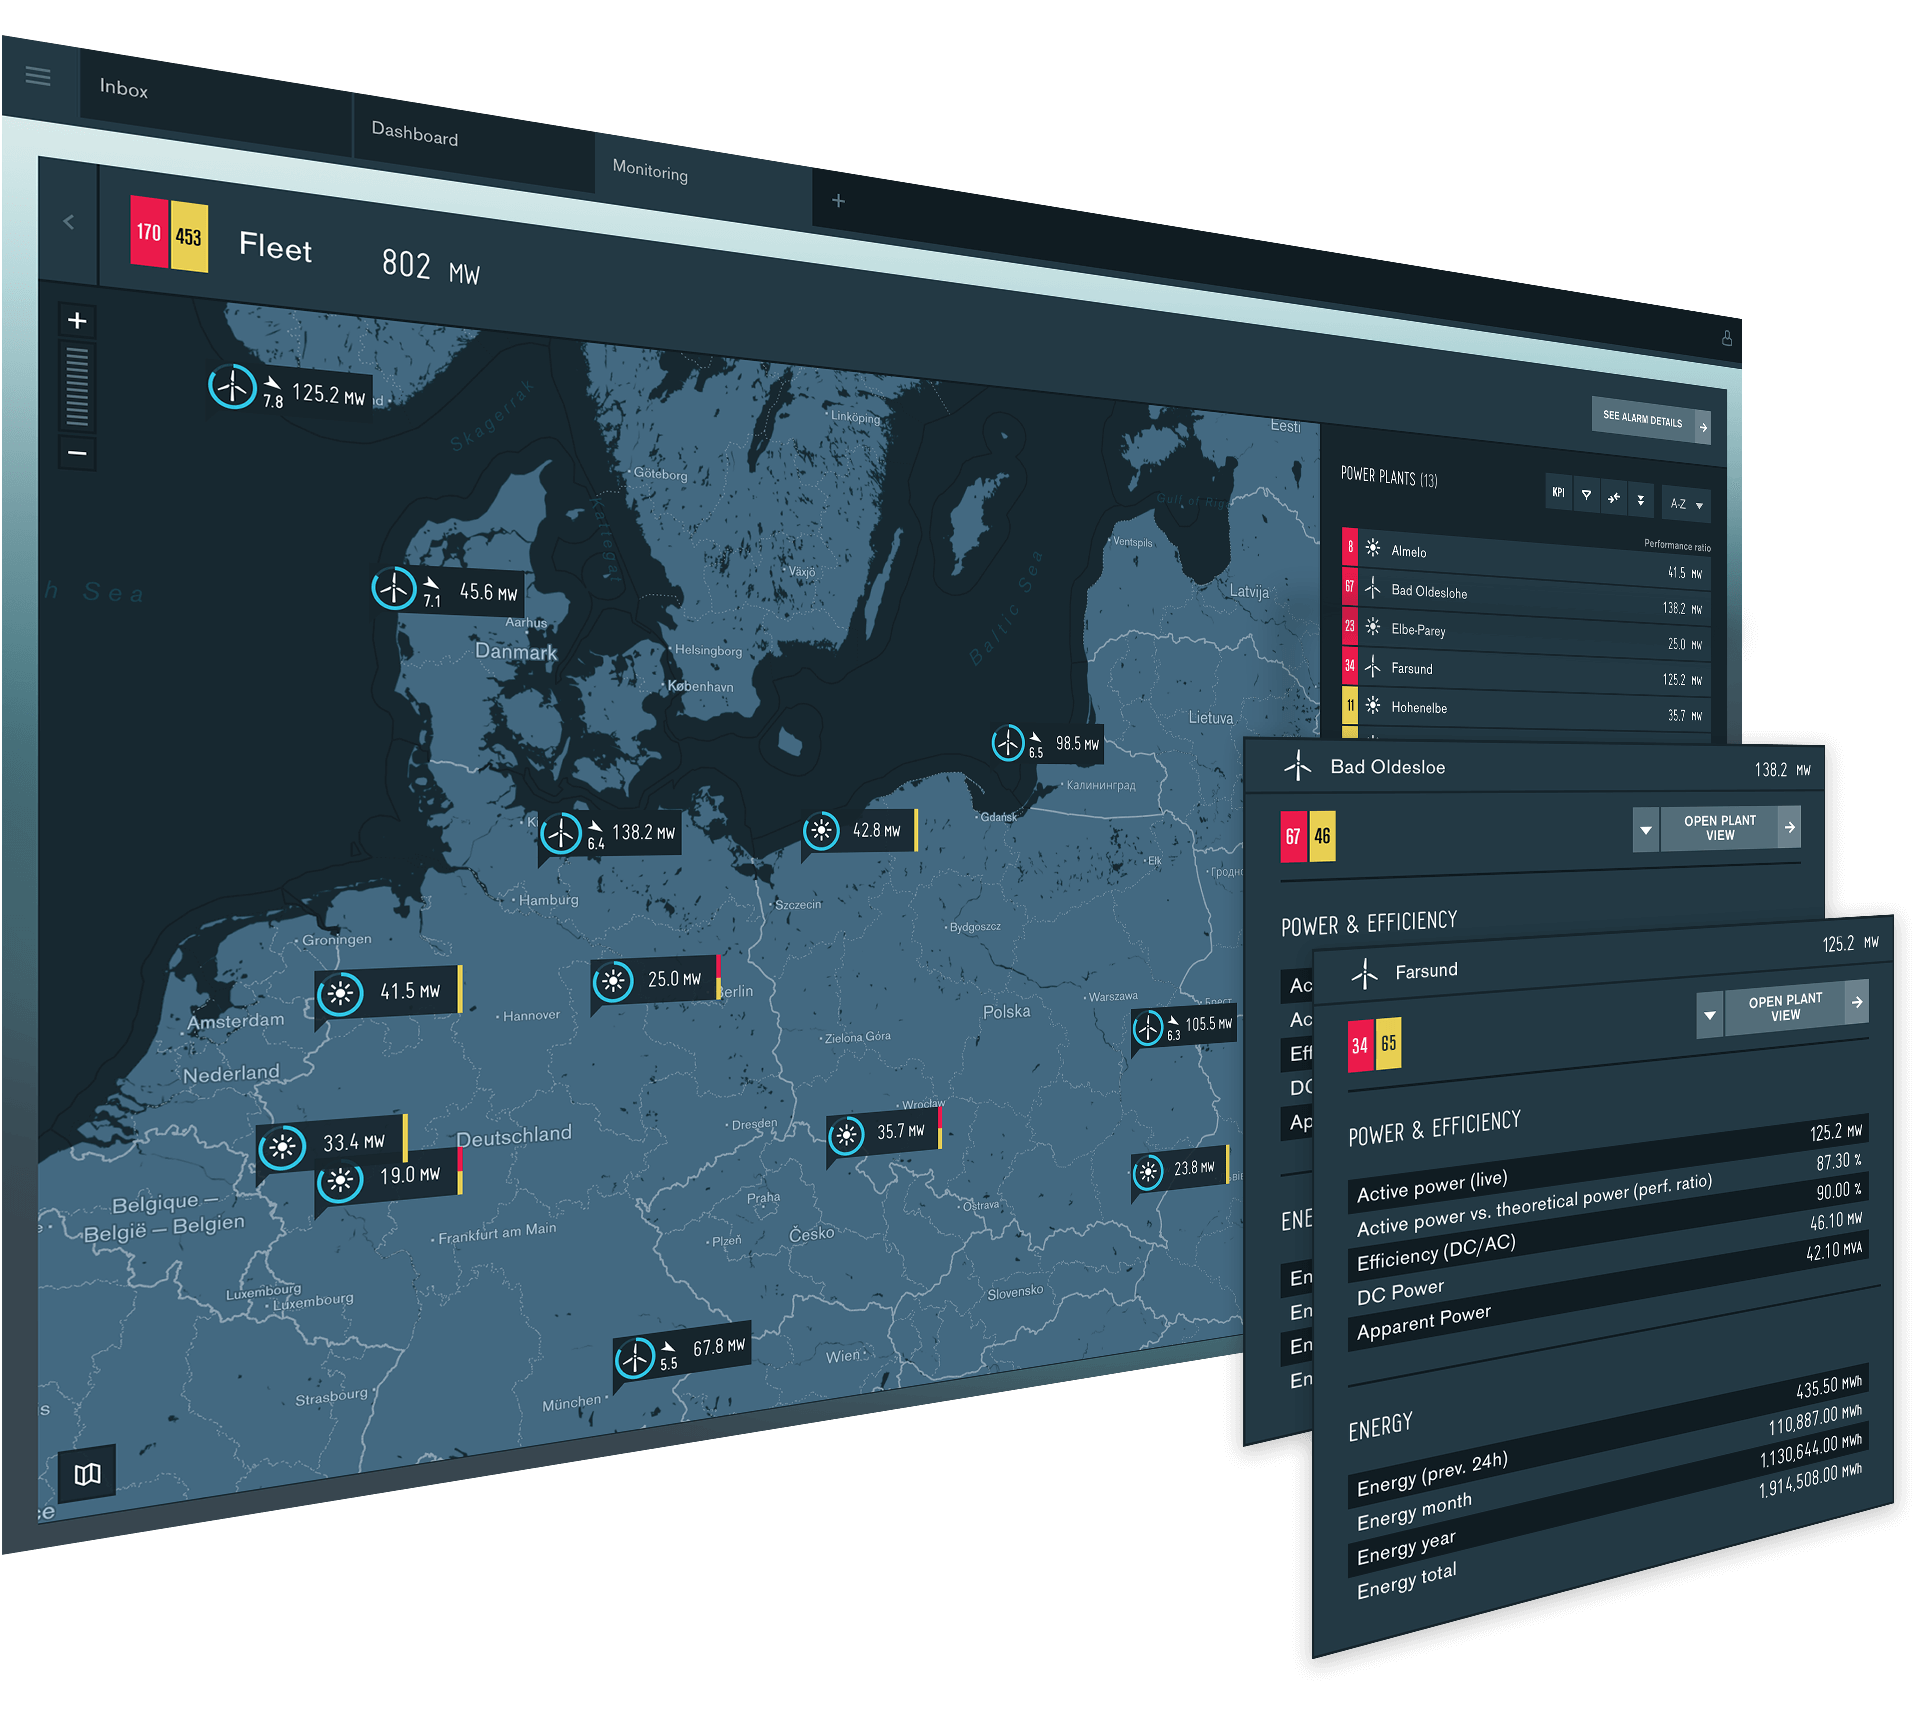
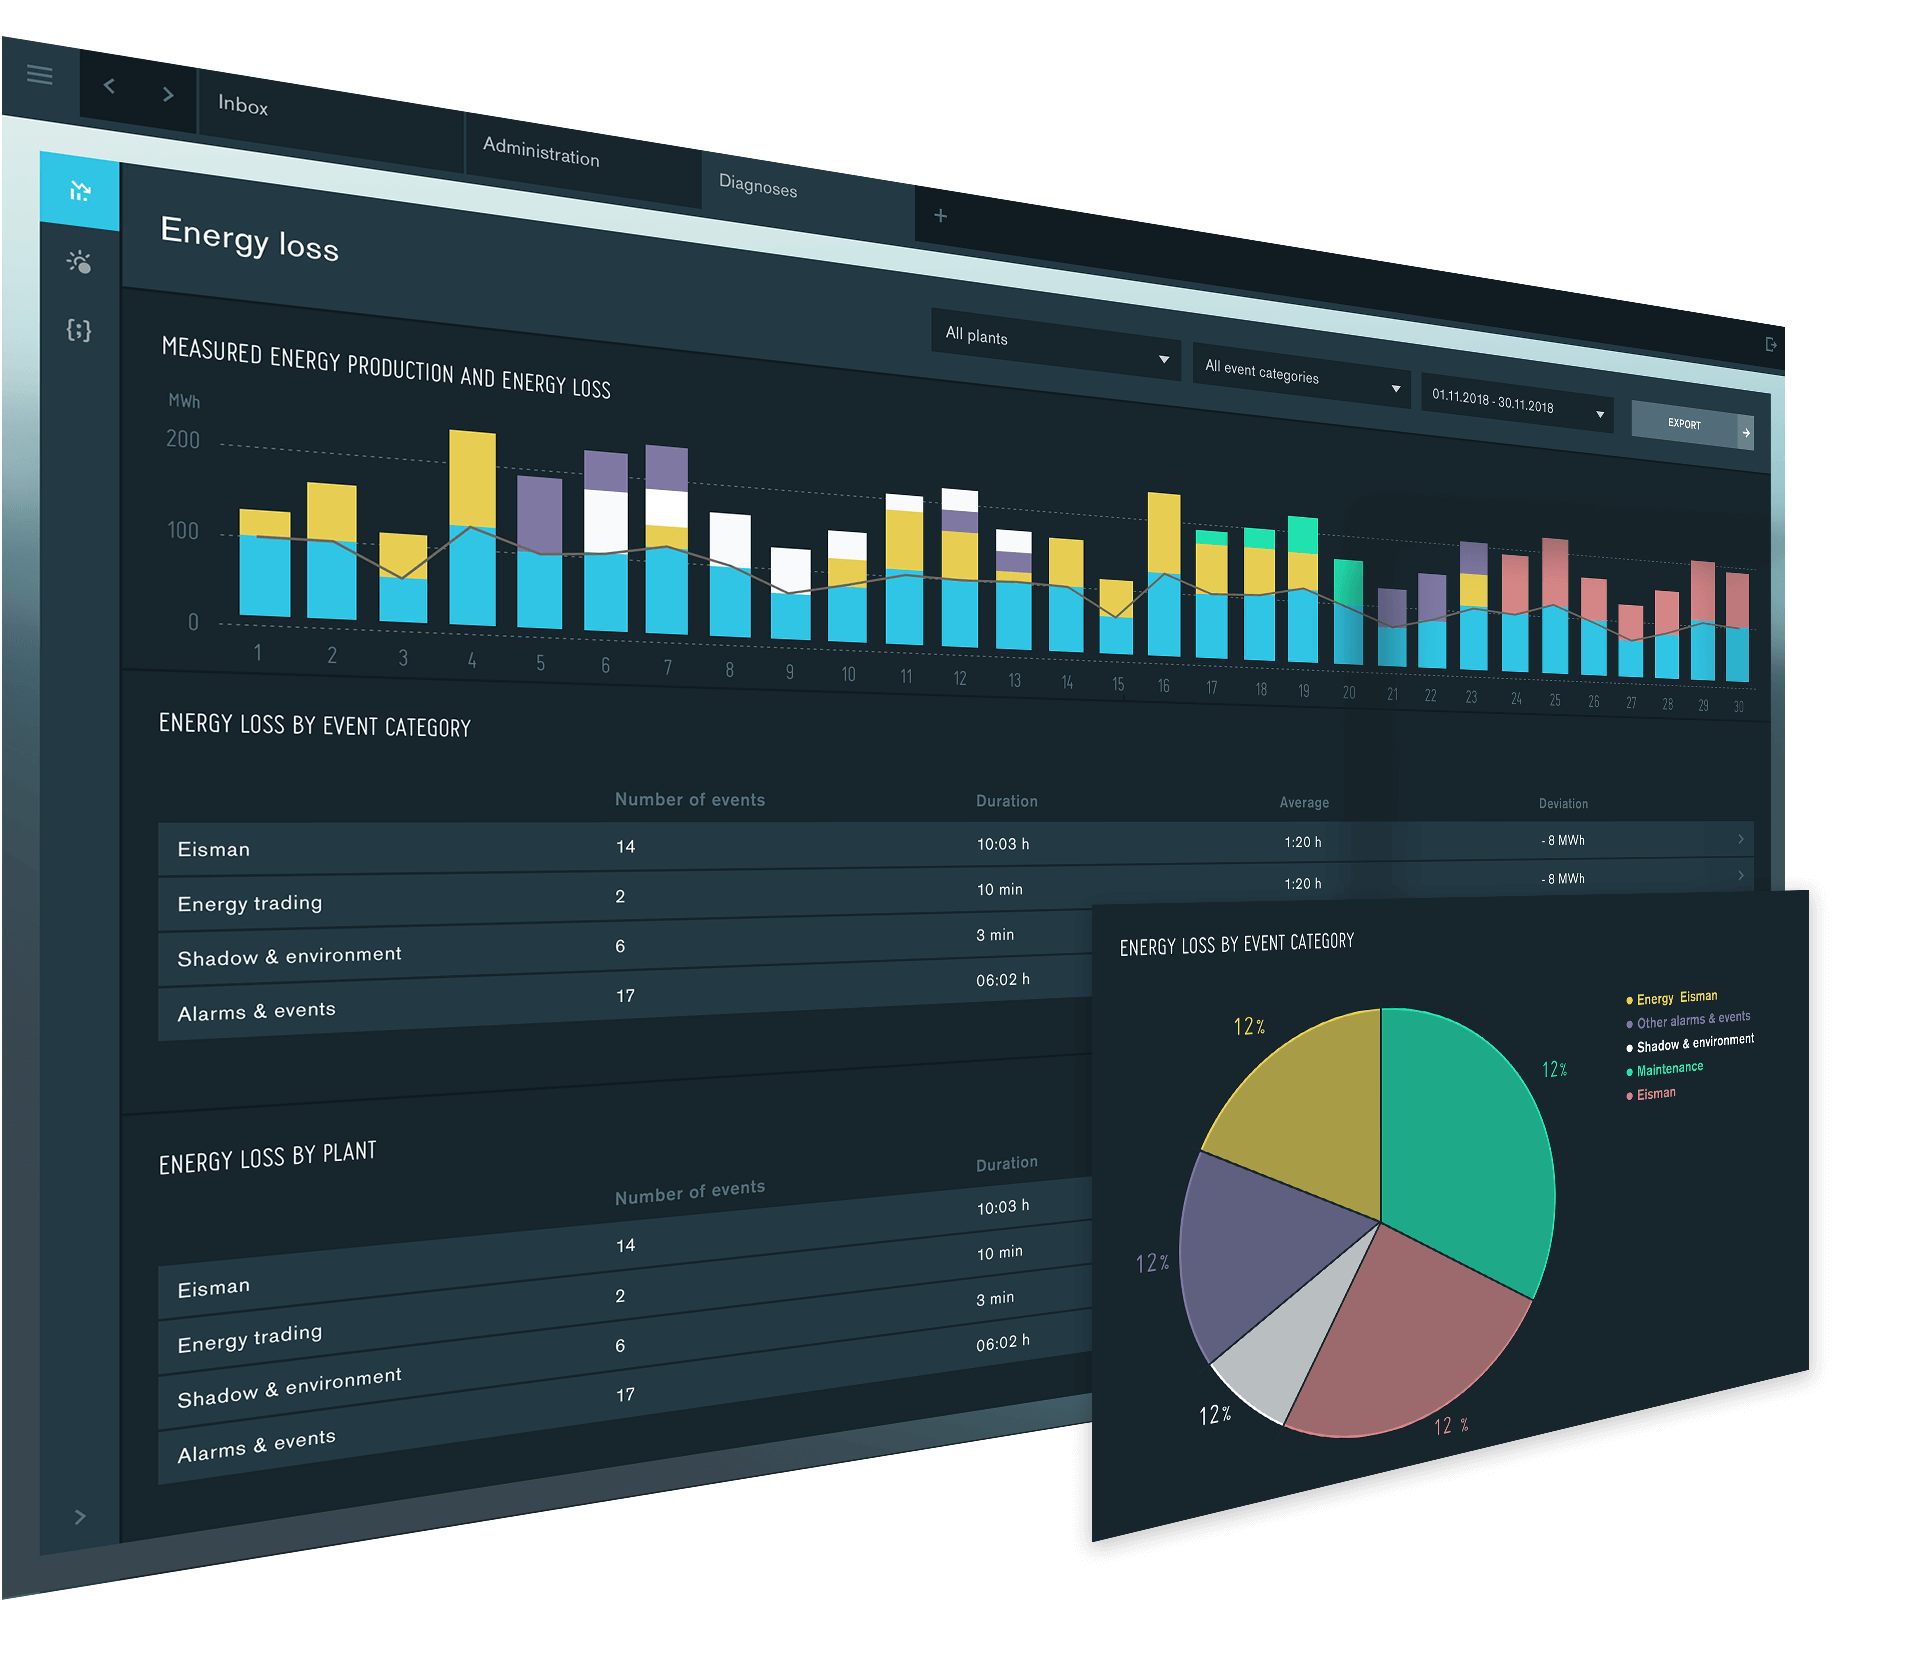
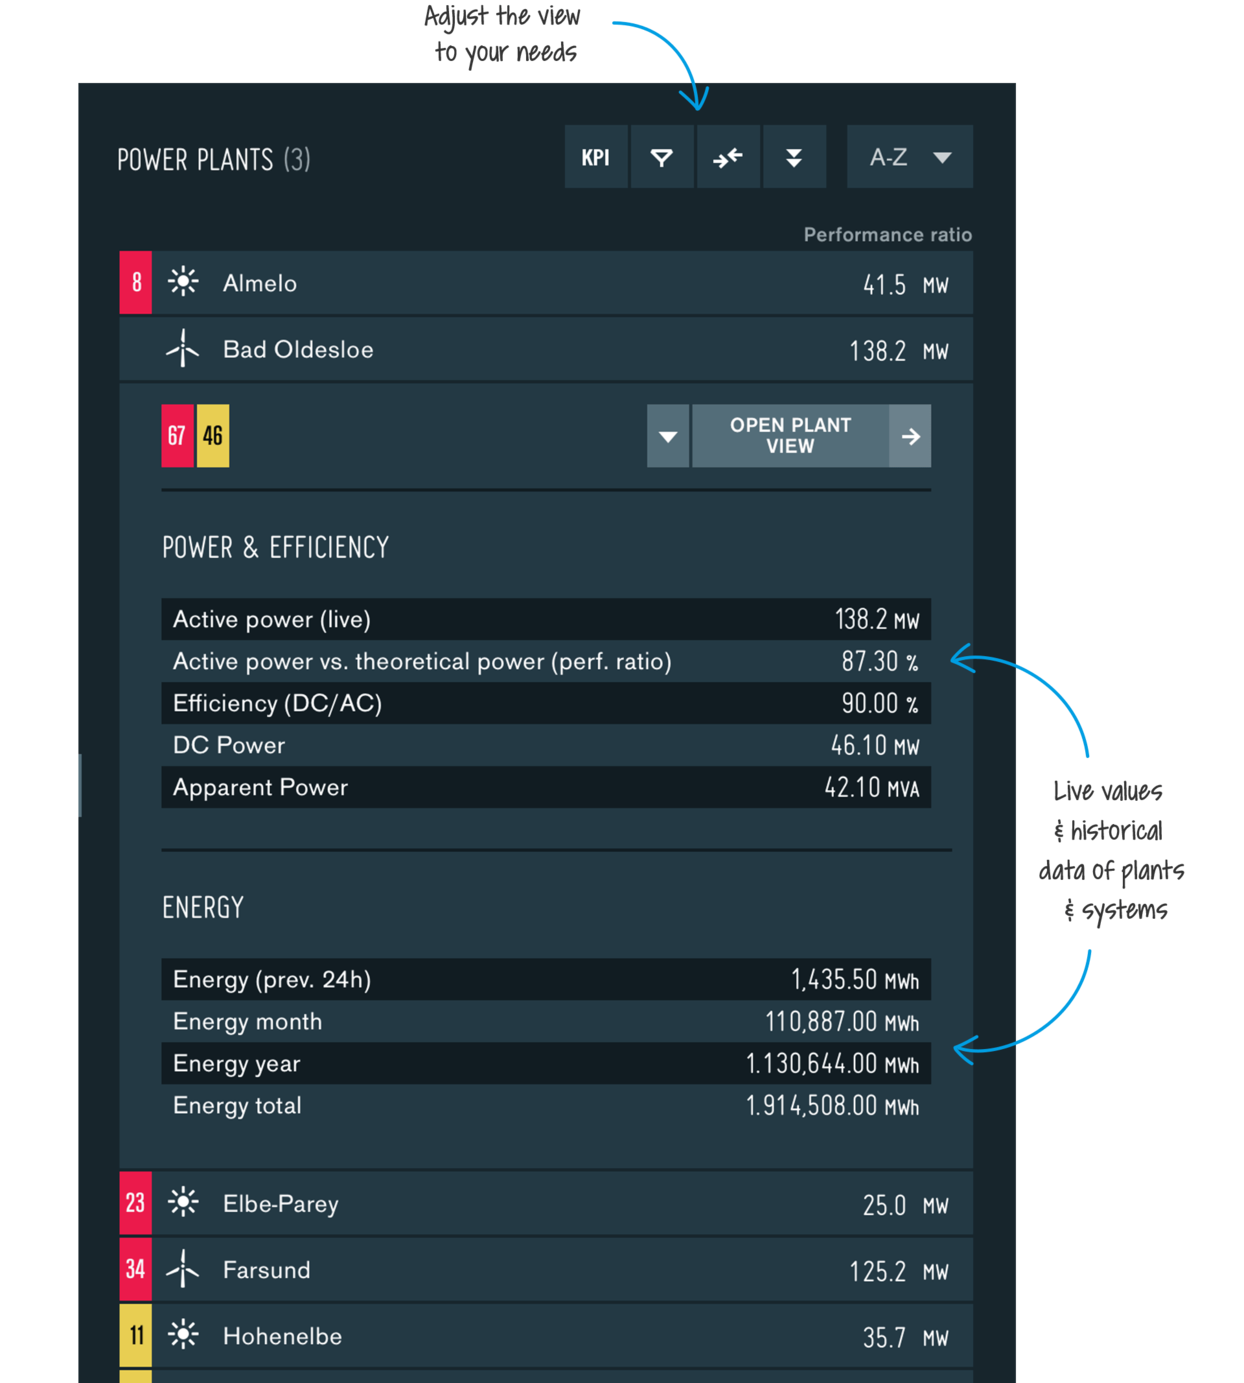
All power plants, all KPIs, one repository.
With the integrated repository of birdy7 monitoring, you can find all the information about your power plant or power plant fleet in one place. Whether KPI-based on the raw data of your power plants (e. g. measured values, operating conditions, meters) or individually generated KPIs (calculated values, alarms, events). birdy7 monitoring provides your data context-related on fleet-, power plant, system and component level, where you can quickly and very clearly view, monitor and compare this information. And the best thing about it is: everything can be configured and adapted to your individual needs!
Best-performer, least-performer? Quickly know.
The filtering and sorting functionality lets you quickly establish which systems perform best in a given time period. And which systems need a bit of tweaking and fine-tuning.
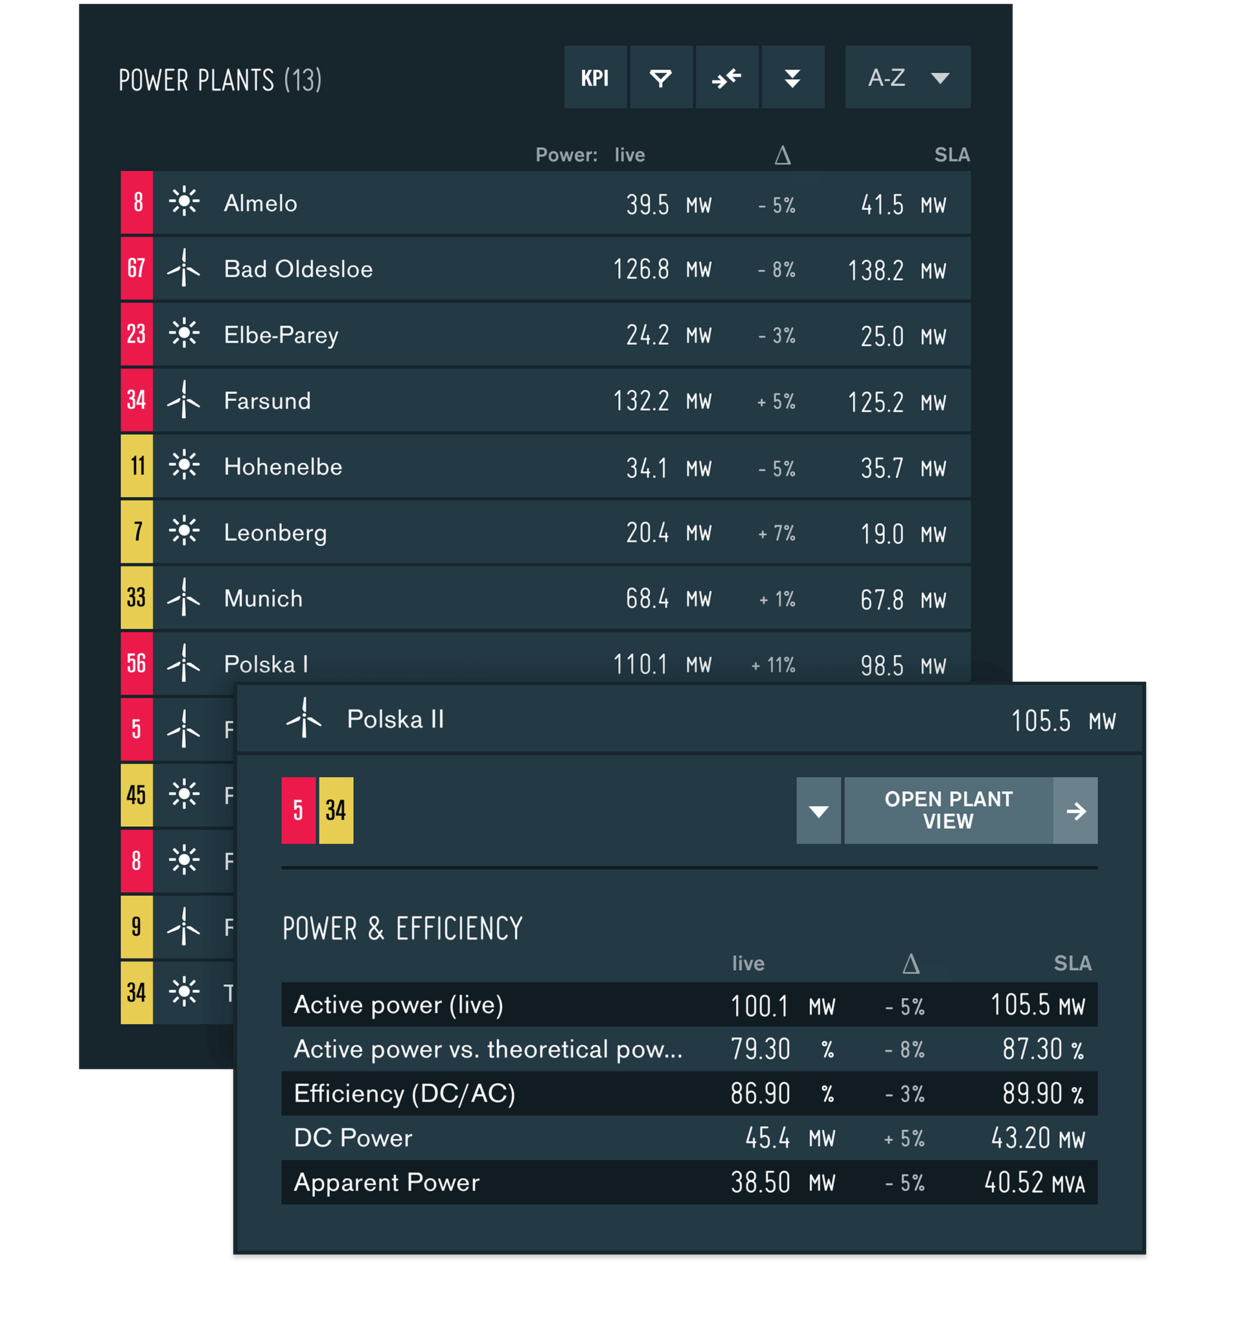
Real vs. expected. As easy as pie.
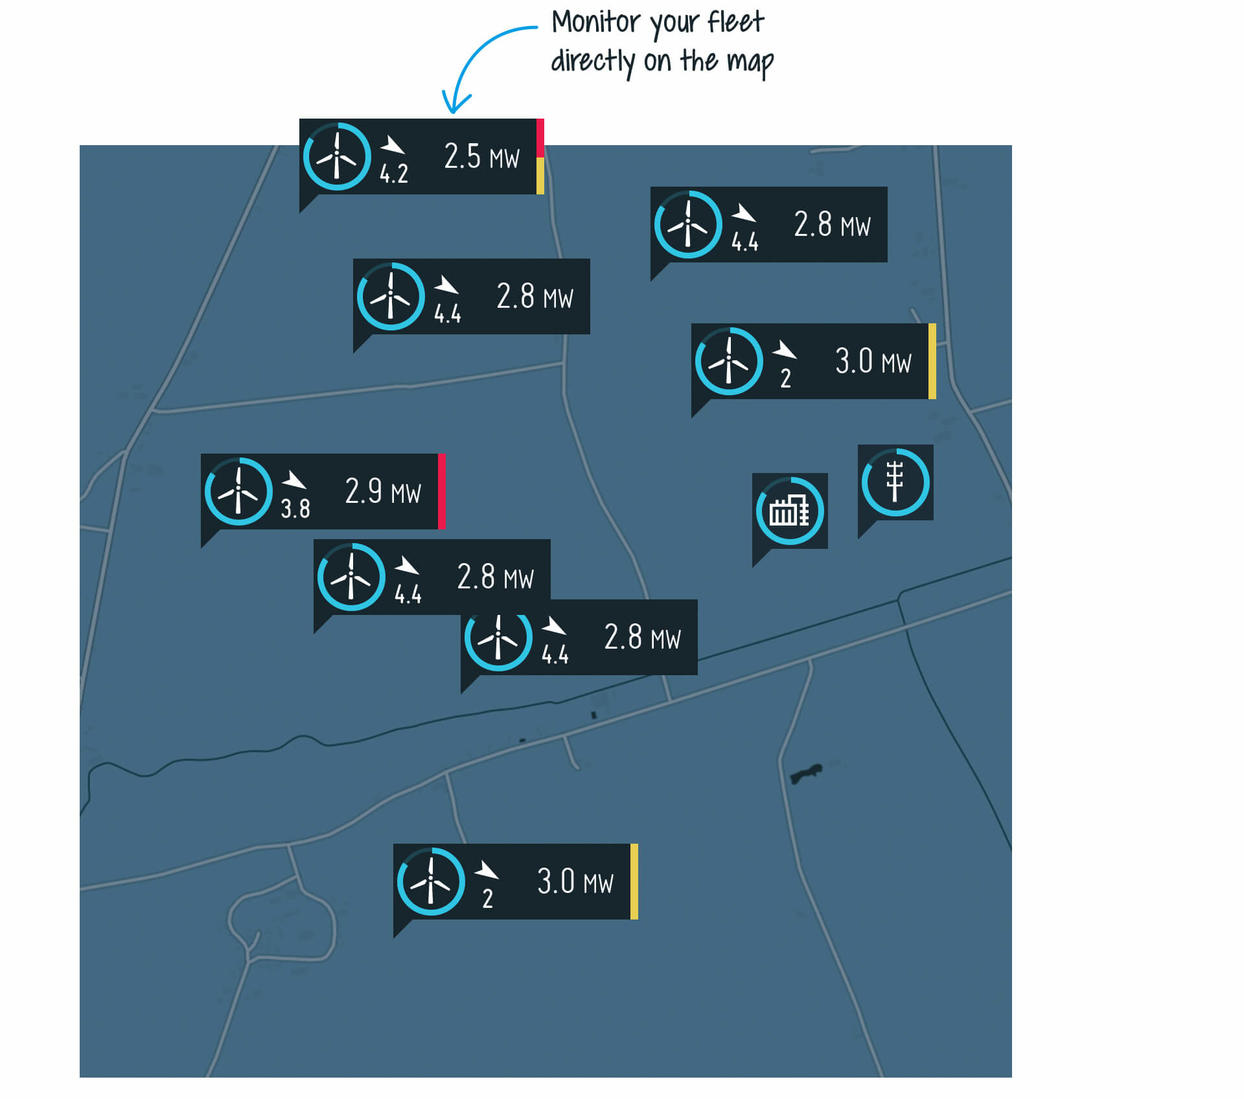
Compare actual measured values with expected values or setpoints. In various locations in the application GUI and with pins on the maps, KPIs with their theoretical values are displayed concurrently. This ensures an easy and intuitive evaluation.