birdy7®Client

Renewables are complex. But it doesn’t need to be complicated. So we designed birdy7® to be intuitive, meet users’ specific needs. And to take some weight of their shoulders.

Diagnostics

Performance losses, production losses, limited availability - and you do not know why? Reviewing and assessing curtailment, energy trading and compliance with regulatory requirements for plant operation - and you do not know how? That was all once. With the integrated analysis tool birdy7 Diagnostics you can create your own evaluations or simply apply already created ones. Whether simple or very complex analyzes, whether in a technical or commercial context, you determine the content and the output format of your analyzes with the integrated diagnostics and chart editor itself.

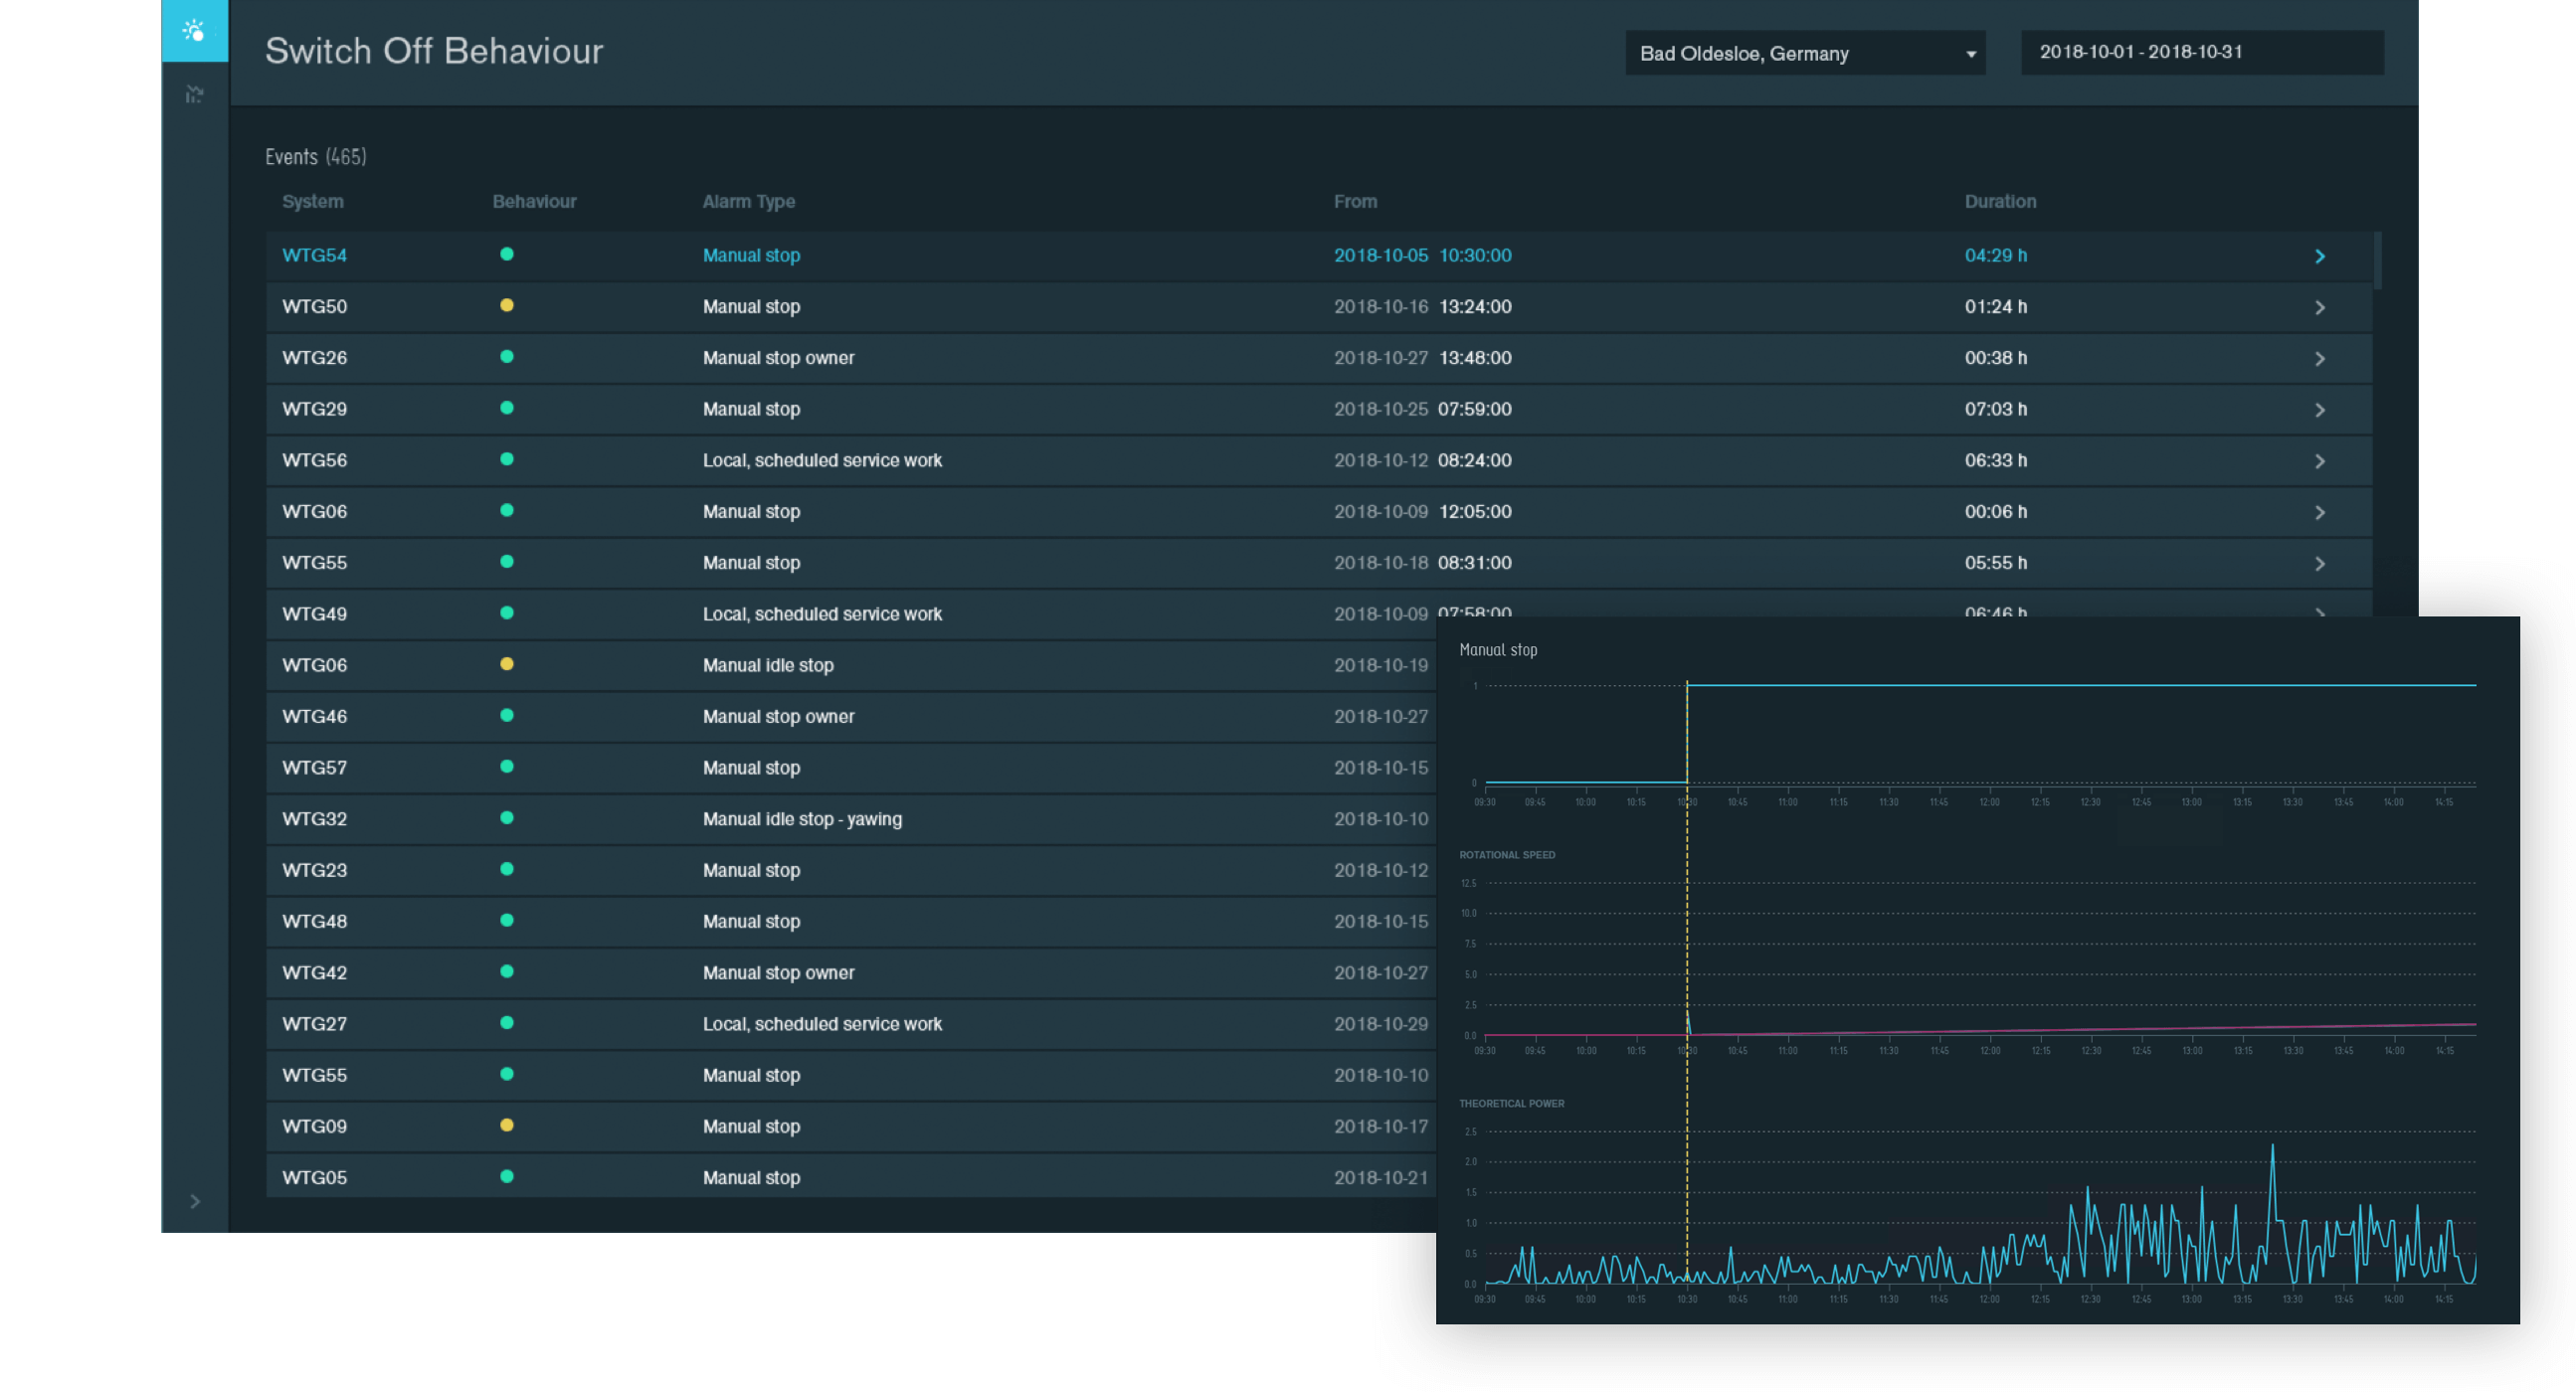
Financial & technical Diagnostics

Use the available data to answer your technical and financial questions.
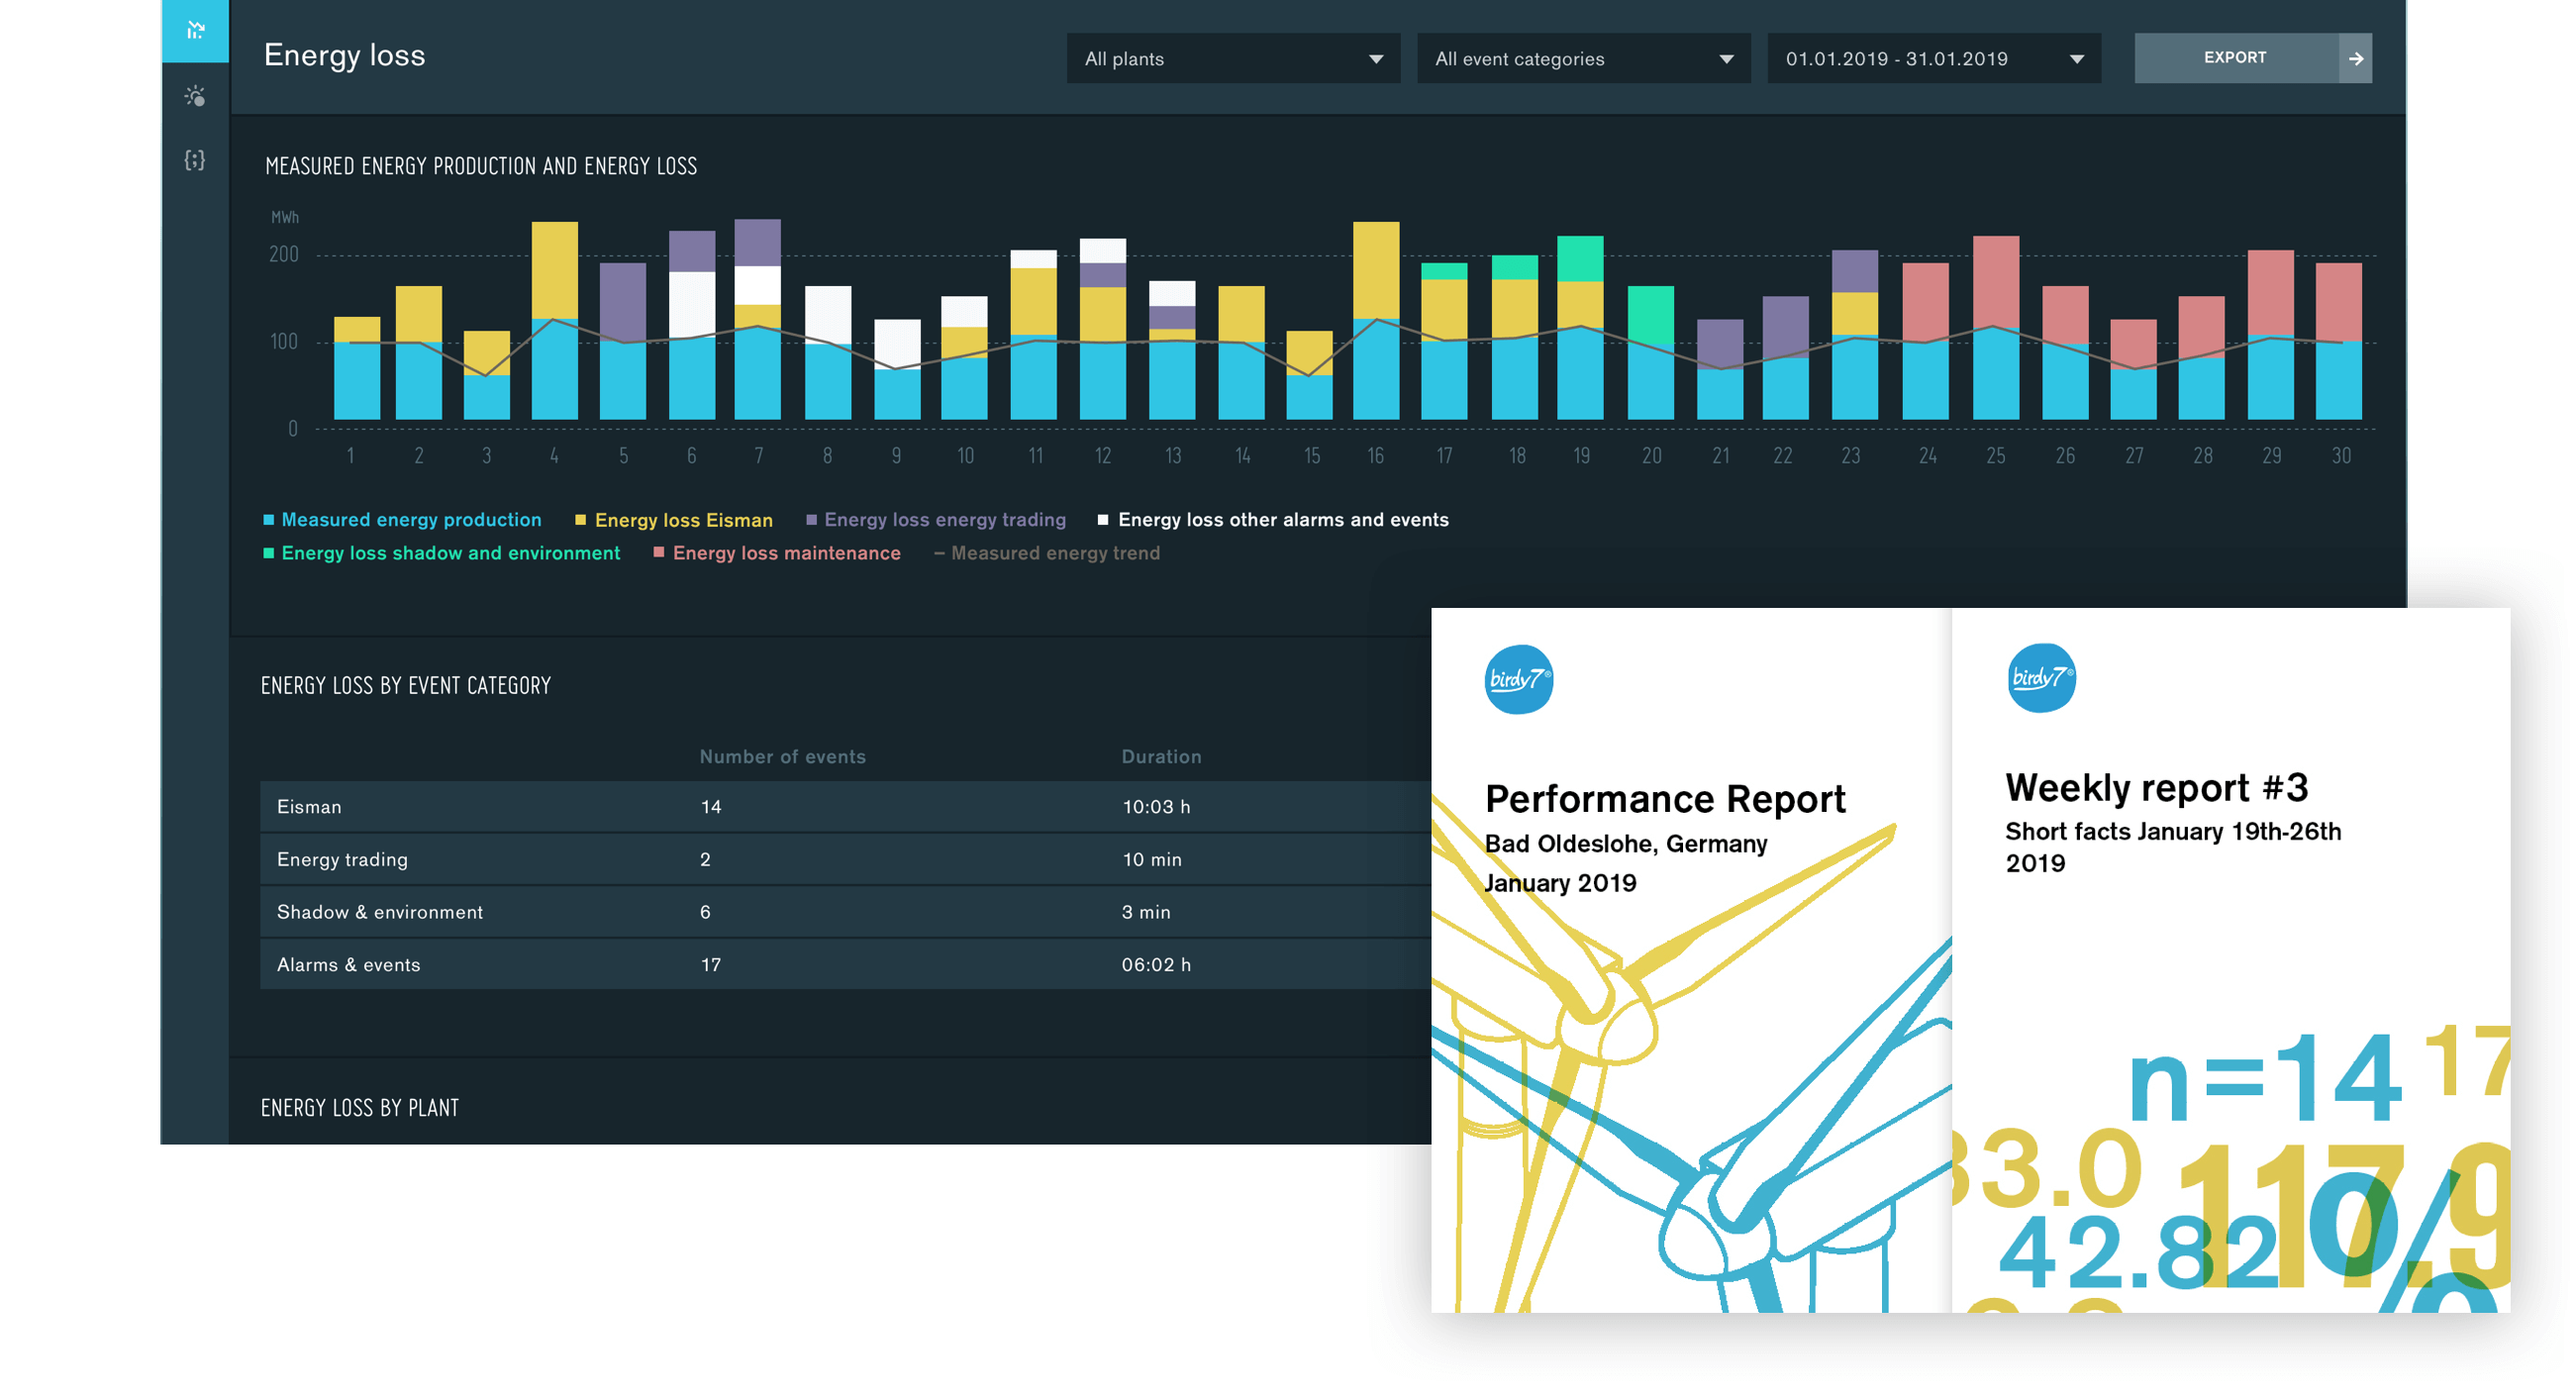
Availability Diagnostics

Check the availability of your power plants on time-based or energy-based methods and analyze the possible reasons for deviations from the business goals.

Power loss Diagnostics

Analyze the reasons for production losses, and gain the confidence to act quickly to prevent downtime.

Alarms & events Diagnostics

Analyze alarms and events in a time period and optimize the availability of your power plants.

Fleet-level Diagnostics

Evaluate and compare the performance of various power plants. Our abstract data model makes this possible.

Curtailment Diagnostics

Ensure that your power plants react correctly to curtailment events (e.g. Eisman) and calculate the corresponding production losses.

Reporting

Creating reports can be a huge expense. Most systems provide only a few and mostly manufacturer-dependent selection of reports. Flexible and directly electronically processable output formats are rather rare. Not to mention the ability to create report templates, their content and the layout yourself. With the integrated reporting tool birdy7 Reporting you create your own, very individual report templates, on the basis of which you then generate your required reports.

Fast & easy Reporting

All your data is in one place. This speeds up reporting tremendously.

Reporting templates

Use the practical templates and modify them to suit your needs.

Fleet-wide Reports

Create reports for comparing power plants to one another. Our abstract data model makes this possible.

Regulatory support

Provide documented proof that your power plants were operating according to regulatory rules and regulations.

Export as PDF or CSV

Export your reports as PDF or CSV for sharing with others, or for external post-processing.

Customization

We’ll gladly create individualized templates for your reporting. Let’s talk.

Problems are often specific. Good solutions also.

 See the potential of individualized birdy7 configurations.

Monitoring

All technologies, one platform. birdy7 finally lets you monitor your entire power plant fleet in one tool. No matter if you have solar-, wind-, hydro- or biogas power plants. All power plants that communicate with an OPC protocol can be integrated with birdy7. Those that use other protocols require an individualized solution, also offered by the birdy7 team.

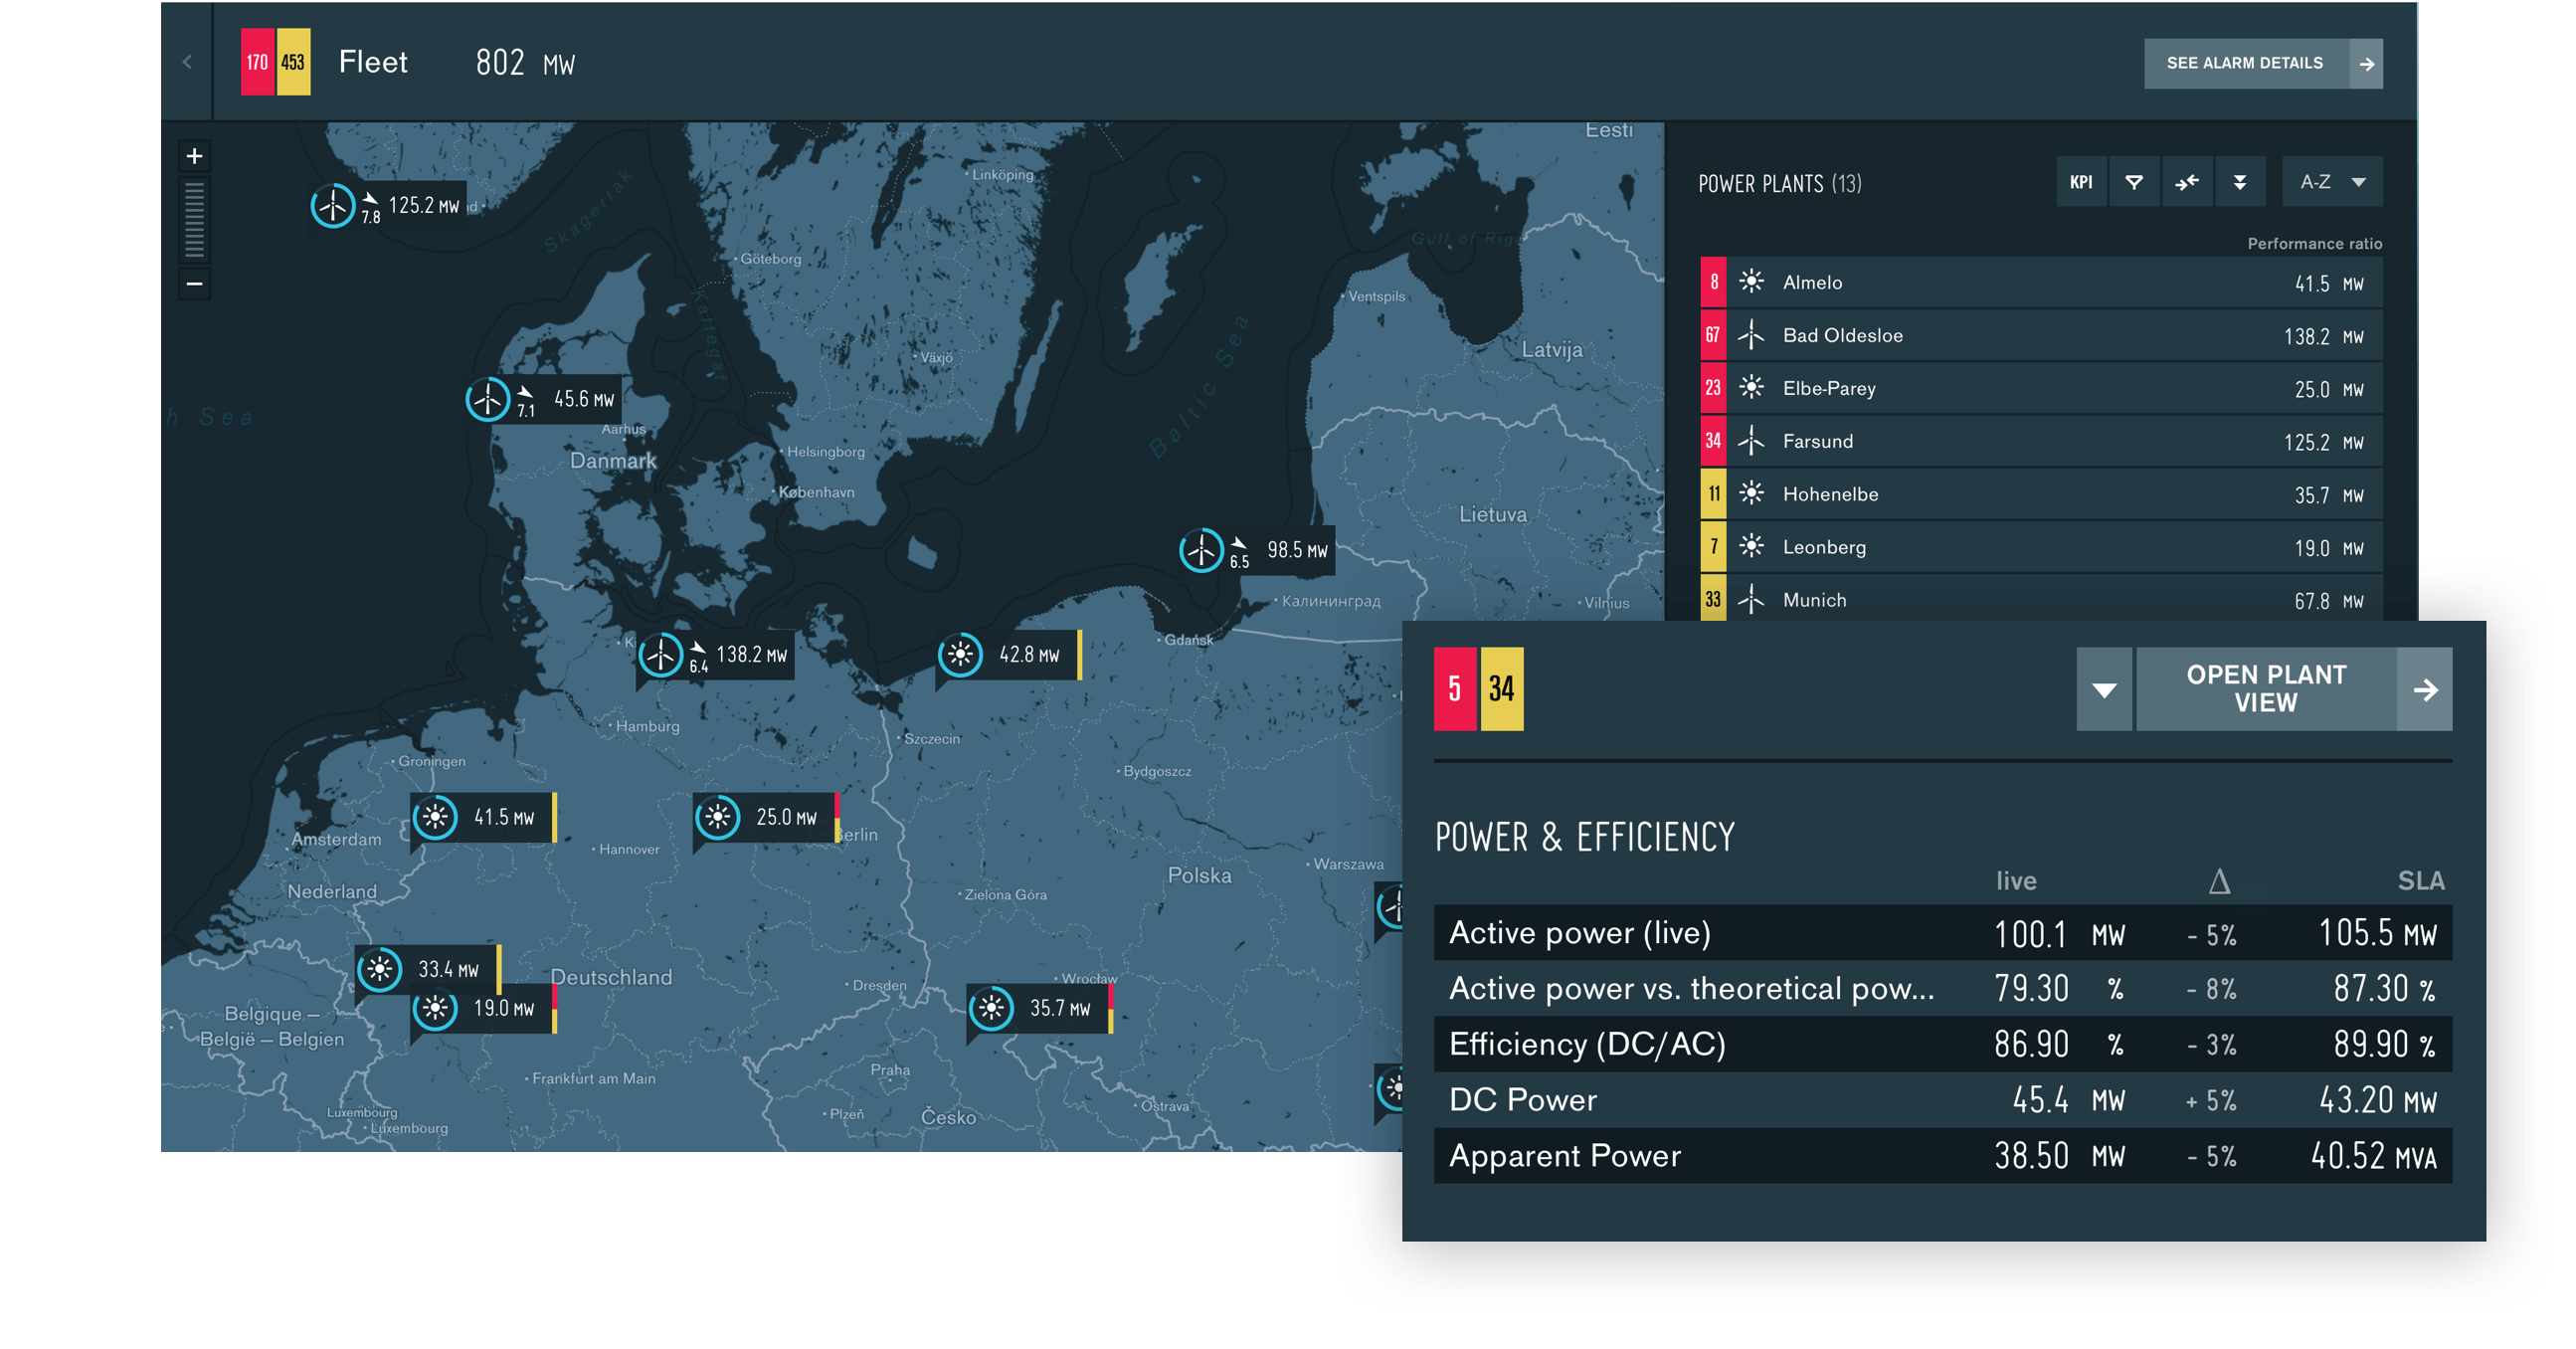
KPIs, alarms, warnings always in view

Always know the latest condition of your power plants with the birdy7 platform. All information is updated immediately as it changes.


Map view for geographical monitoring

See your plants and systems in a geographical overview. Perfect for your video wall.

Drill down to the component-level

birdy7 lets you zoom into the turbine, inverter or string to investigate individual components with sensors attached. As if you’re on site.

Best performer, least-performer? Quickly know

The filtering and sorting functionality lets you quickly establish which systems perform best or least in a given time period.

Real vs. expected production

How does the actual power compare to expected power? Don’t wait for the weekly deviations report; act immediately and reduce your downtime and production losses.

Customization

Do you have additional components in your power plant you need monitored? (STATCOM, LIDAR, bat monitor, etc.). We’ll gladly create a Monitoring GUI to suit your needs.

Inbox

birdy7 Inbox. Support redefined. Alarms from the entire fleet are automatically prioritized and collectively displayed in the Inbox. Processed alarms become tickets, because the inbox is a full-fledged ticket system.  All actions and processes are displayed clearly and transparently. Thanks to the solution guide, alarm processing is faster and more efficient.

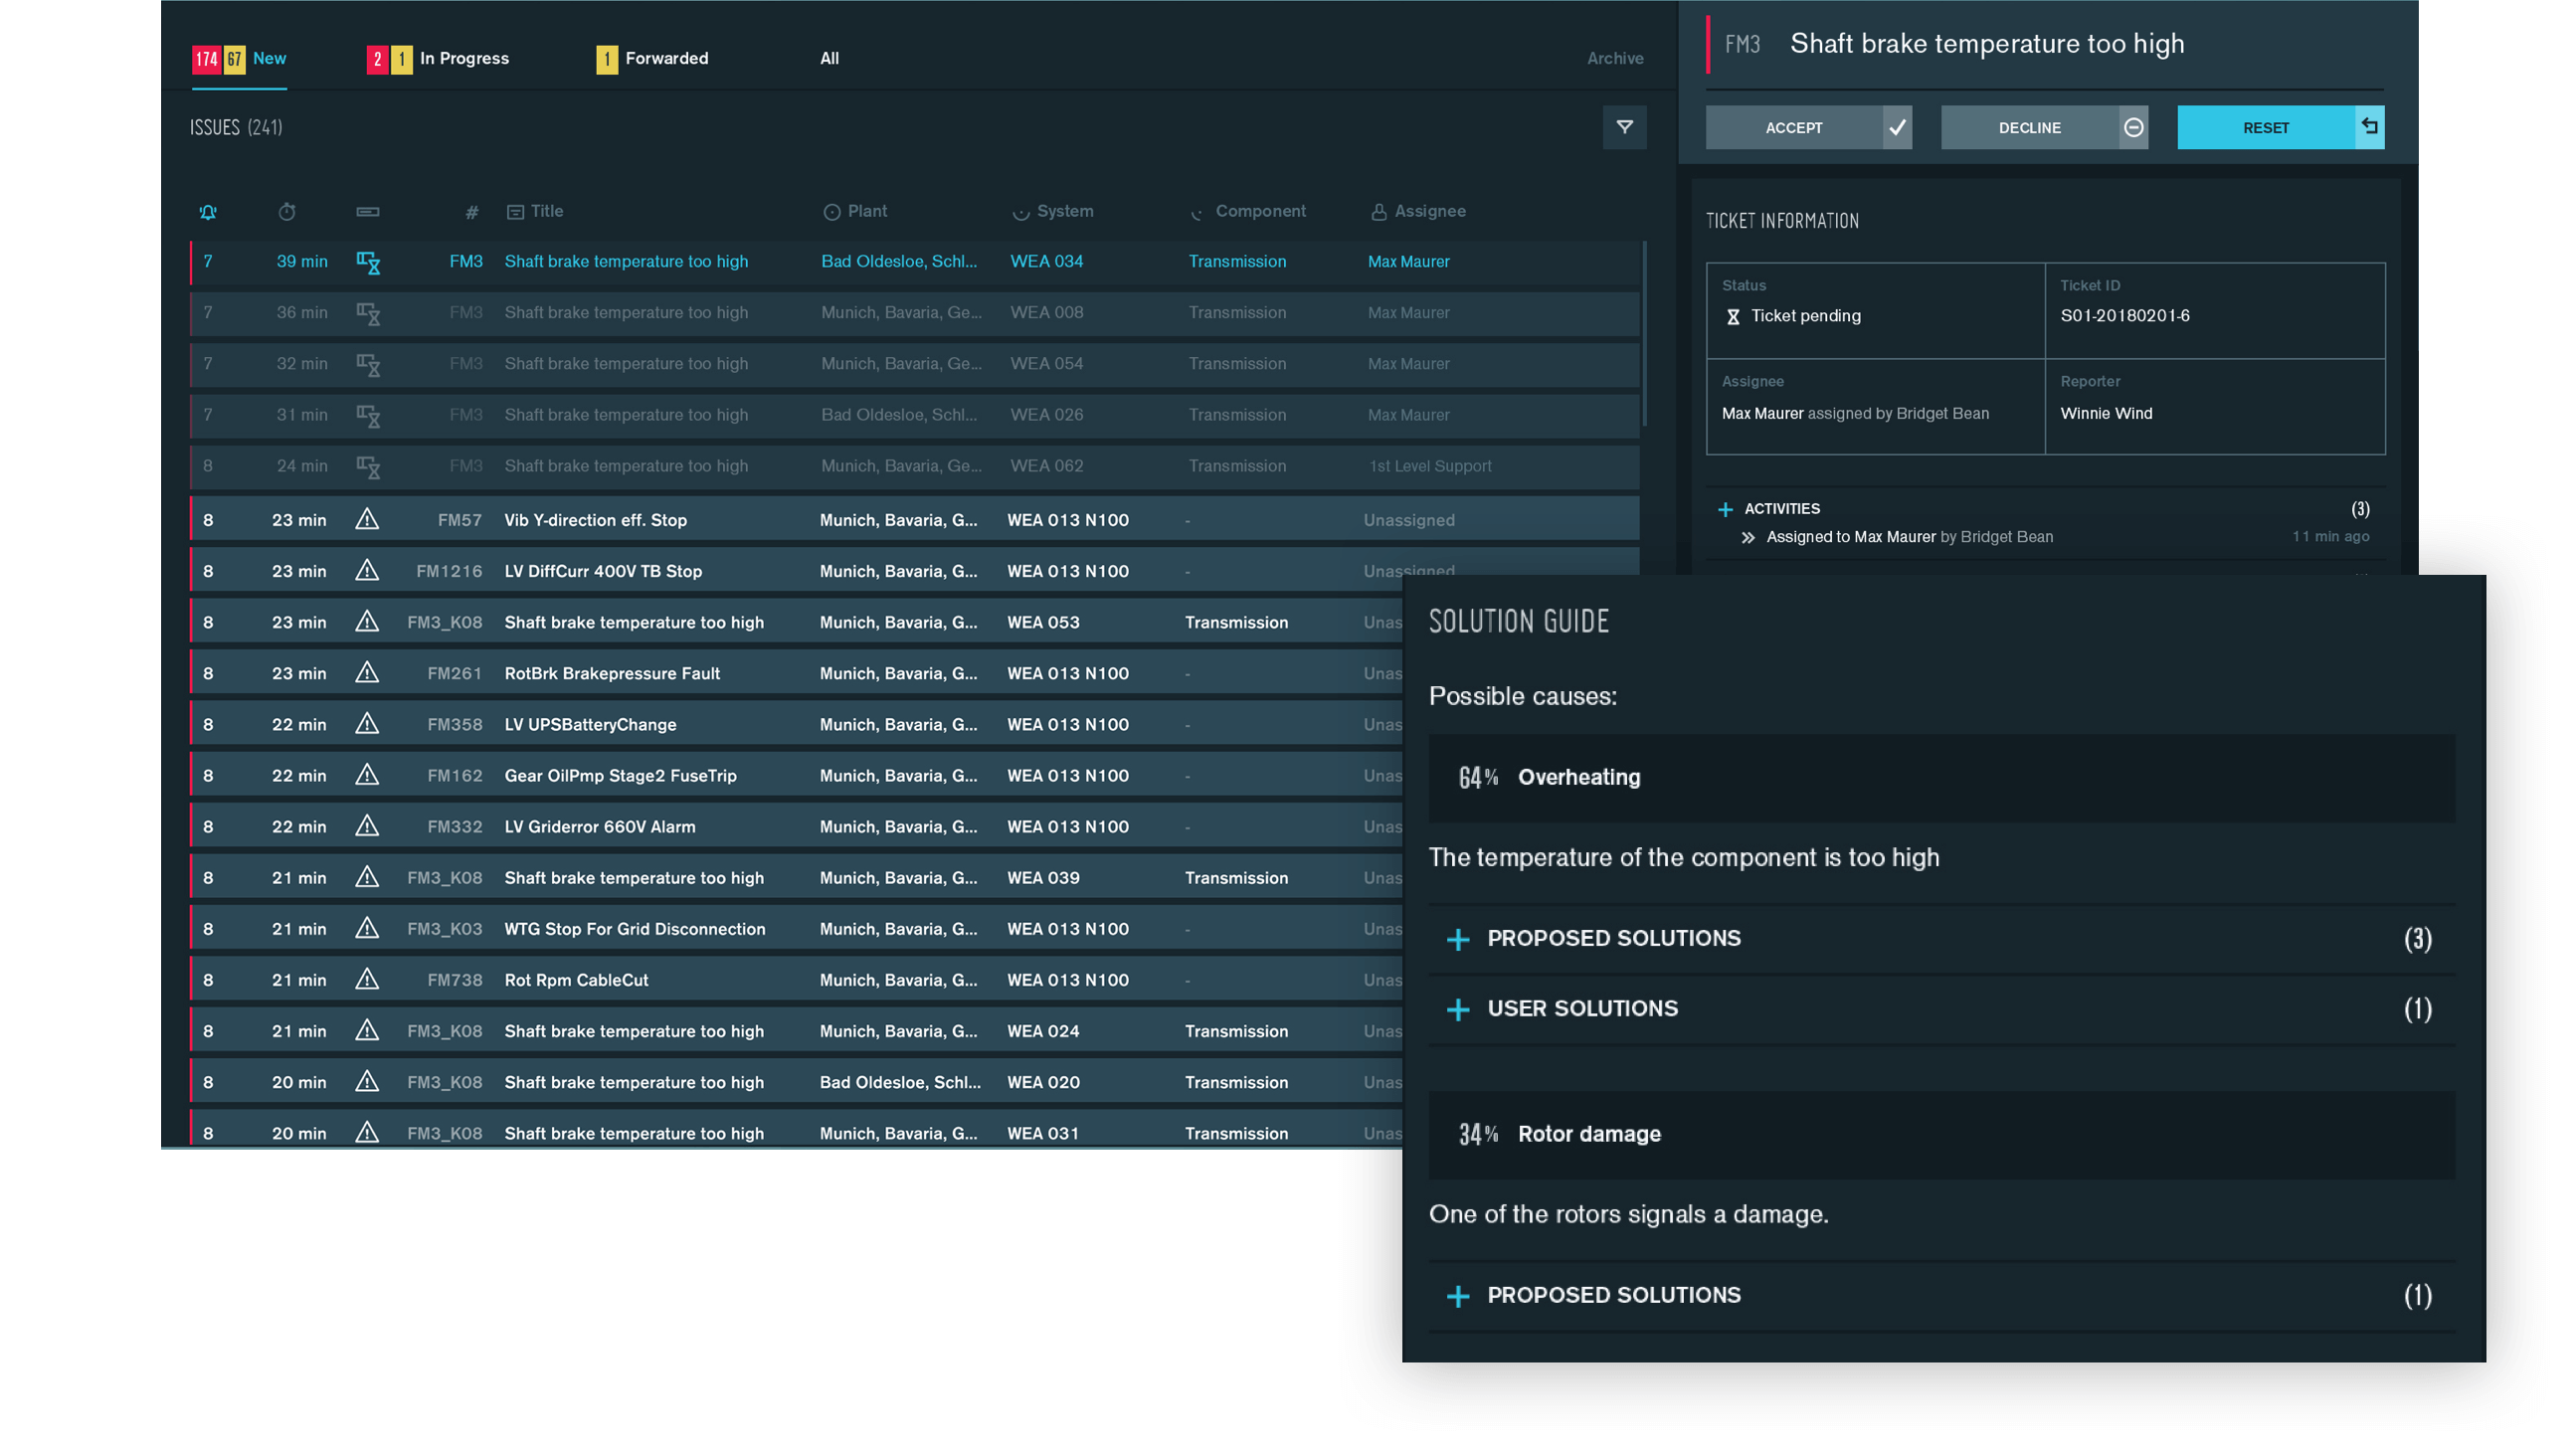
Sorting & prioritizing

Active alarms are automatically sorted and prioritized so that you always know what is curently urgent.

Solution Guide

The Solution Guide informs you with every alarm how it is to be solved and which solutions were successful in the past.

Knowledge Base

When alarms are being addressed, the solution is documented. This constantly grows the Knowledge Base and improves the accuracy of the Solution Guide.

Transparent responsibilities

The assignment of alarms and tickets to persons or groups ensures the responsibilities are always clear to see.

Integrate available databases

You probably already have a user database. With birdy7 you can simply integrate this.

Unique alarms

We’ll help you create unique alarms based on a specific set of conditions. Increase efficiency and reduce downtime.

Problems are often specific. Good solutions also.

See the potential of individualized birdy7 configurations.

Get in touch

You want to know more? Contact us to make an appointment.

Top