iPad Monitoring
From fleet to every single turbine
Made for owners, manufacturers, operators, asset managers or service technicians. Stay informed on the most important performance parameters. The “Wind Farm Portal” iPad app, being the perfect tool to maintain an overview of your performance data, works on three levels: fleet view, wind farm view and turbine view. Live data and trends of all the KPIs are polled directly from the wind farm. By default, the app is connected to the SQL database of your plant and displays the live data as defined there.
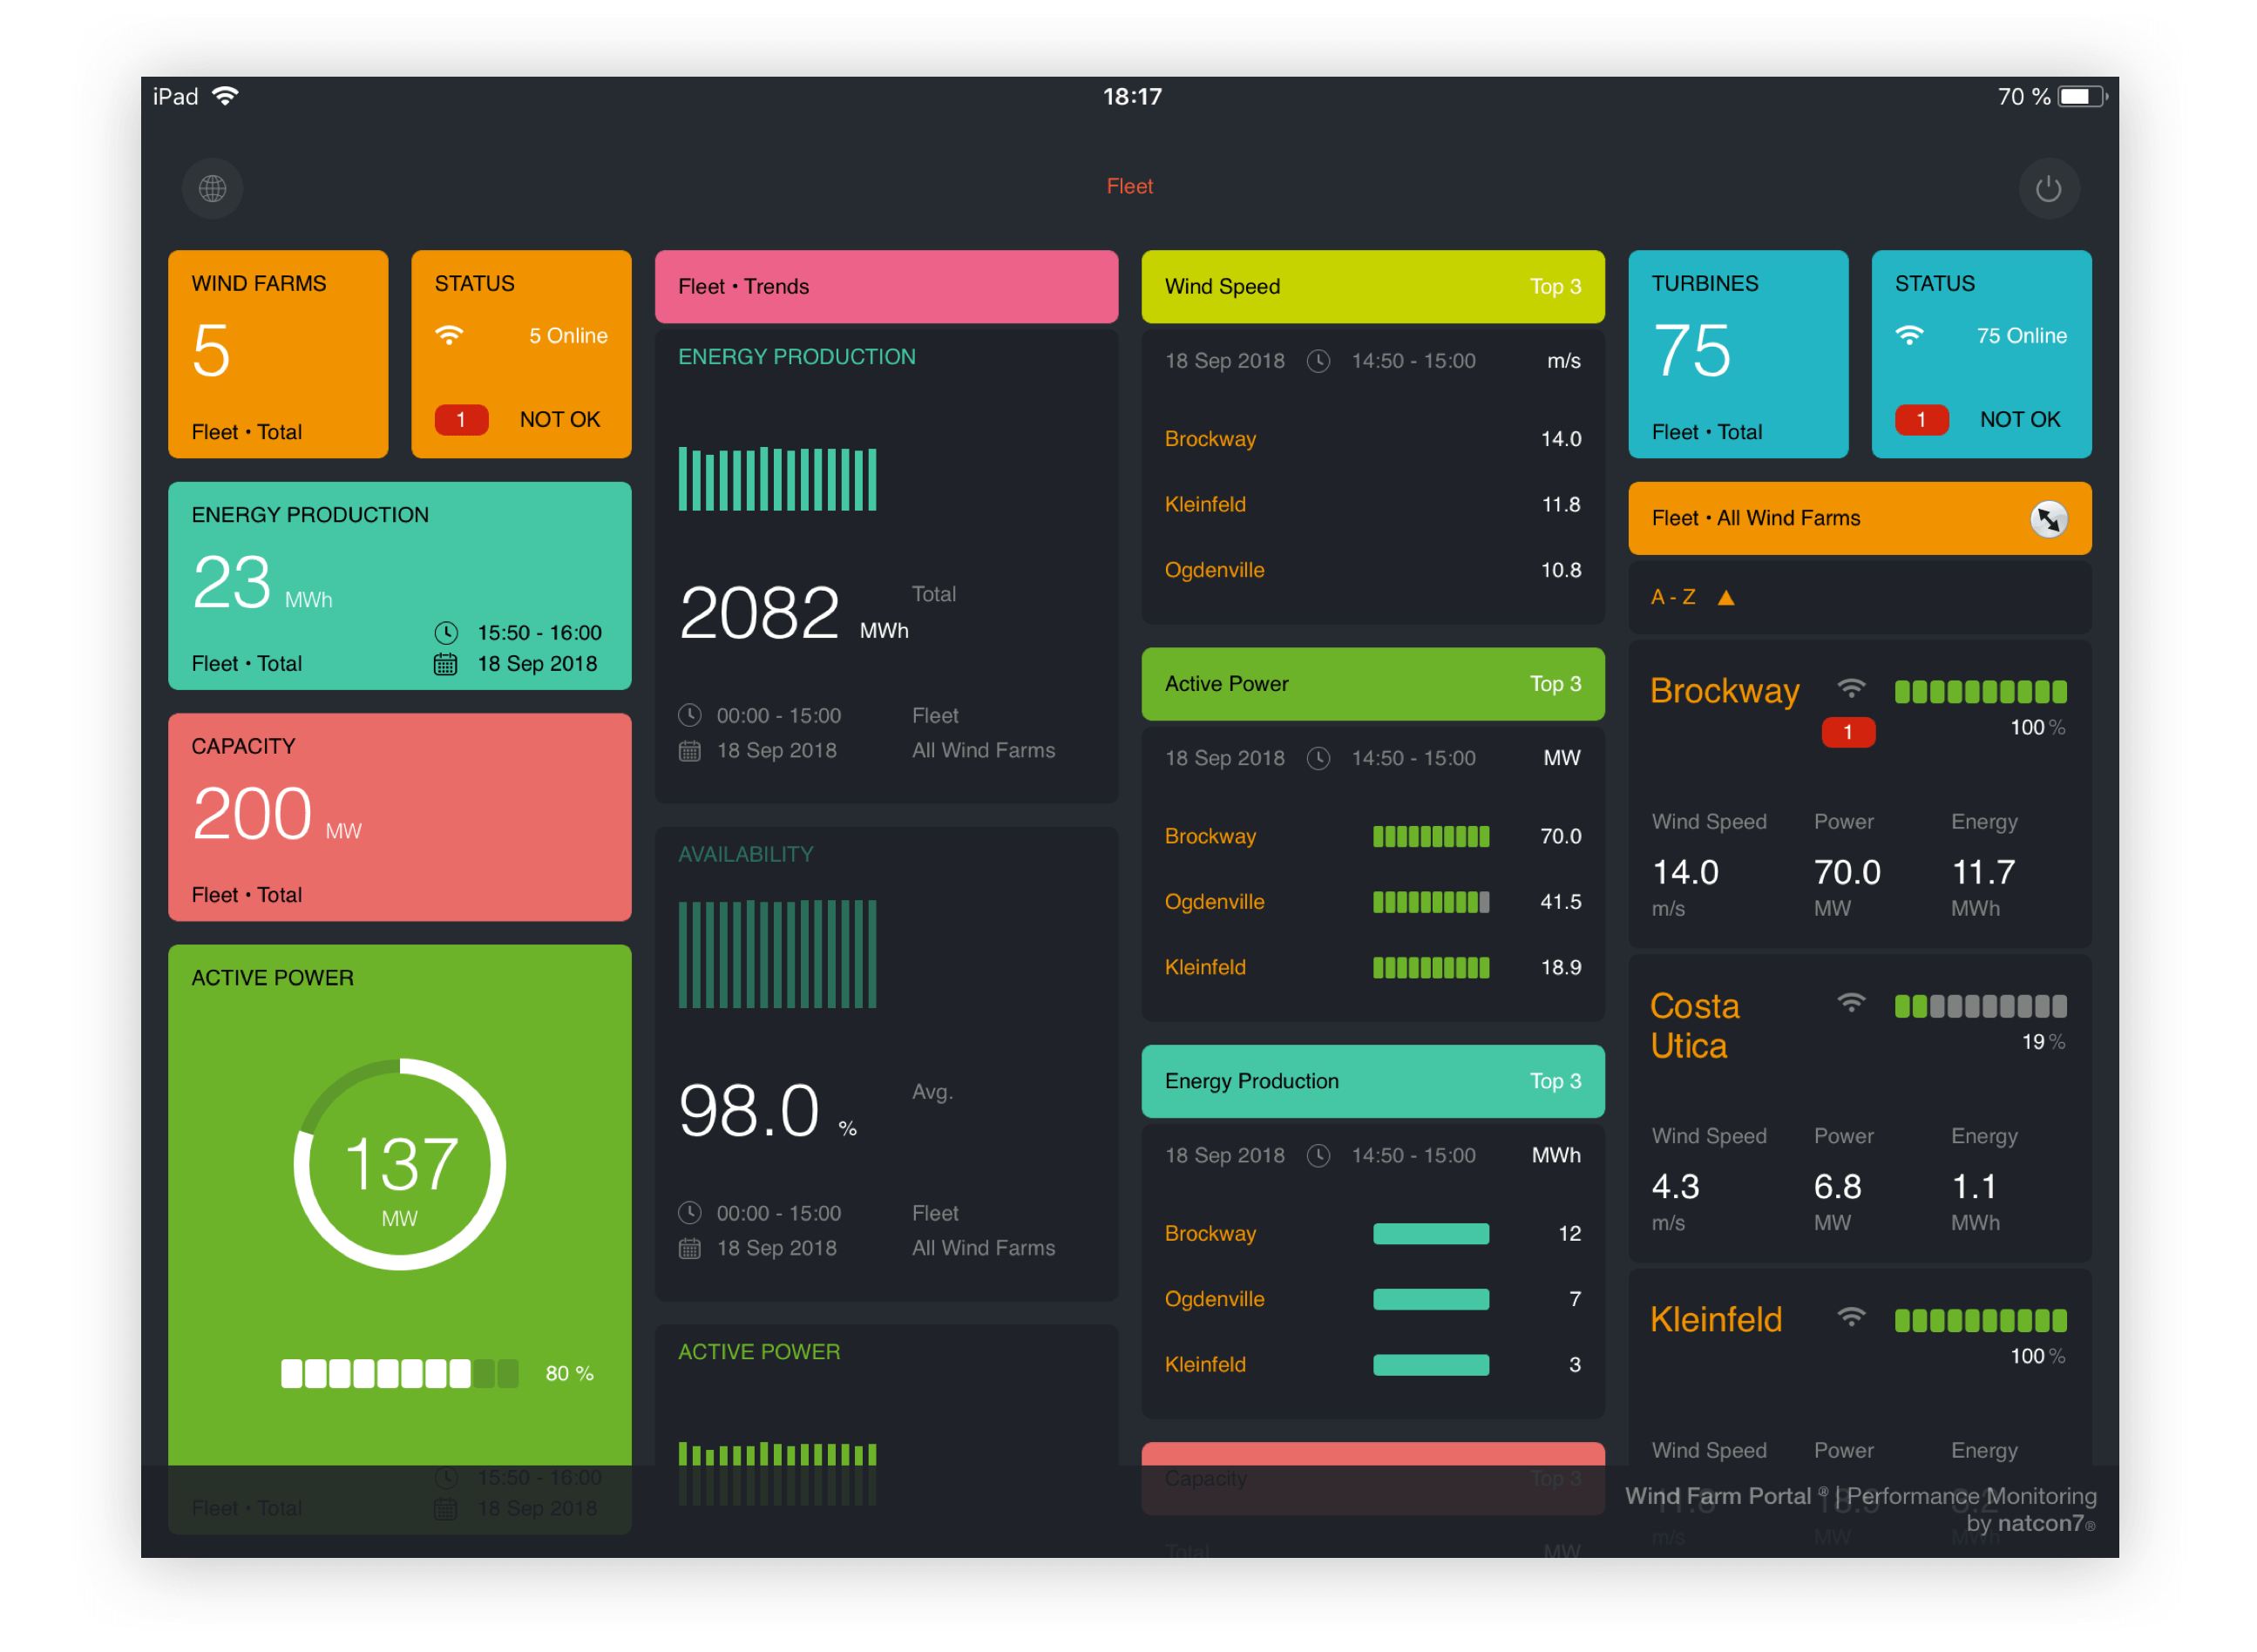

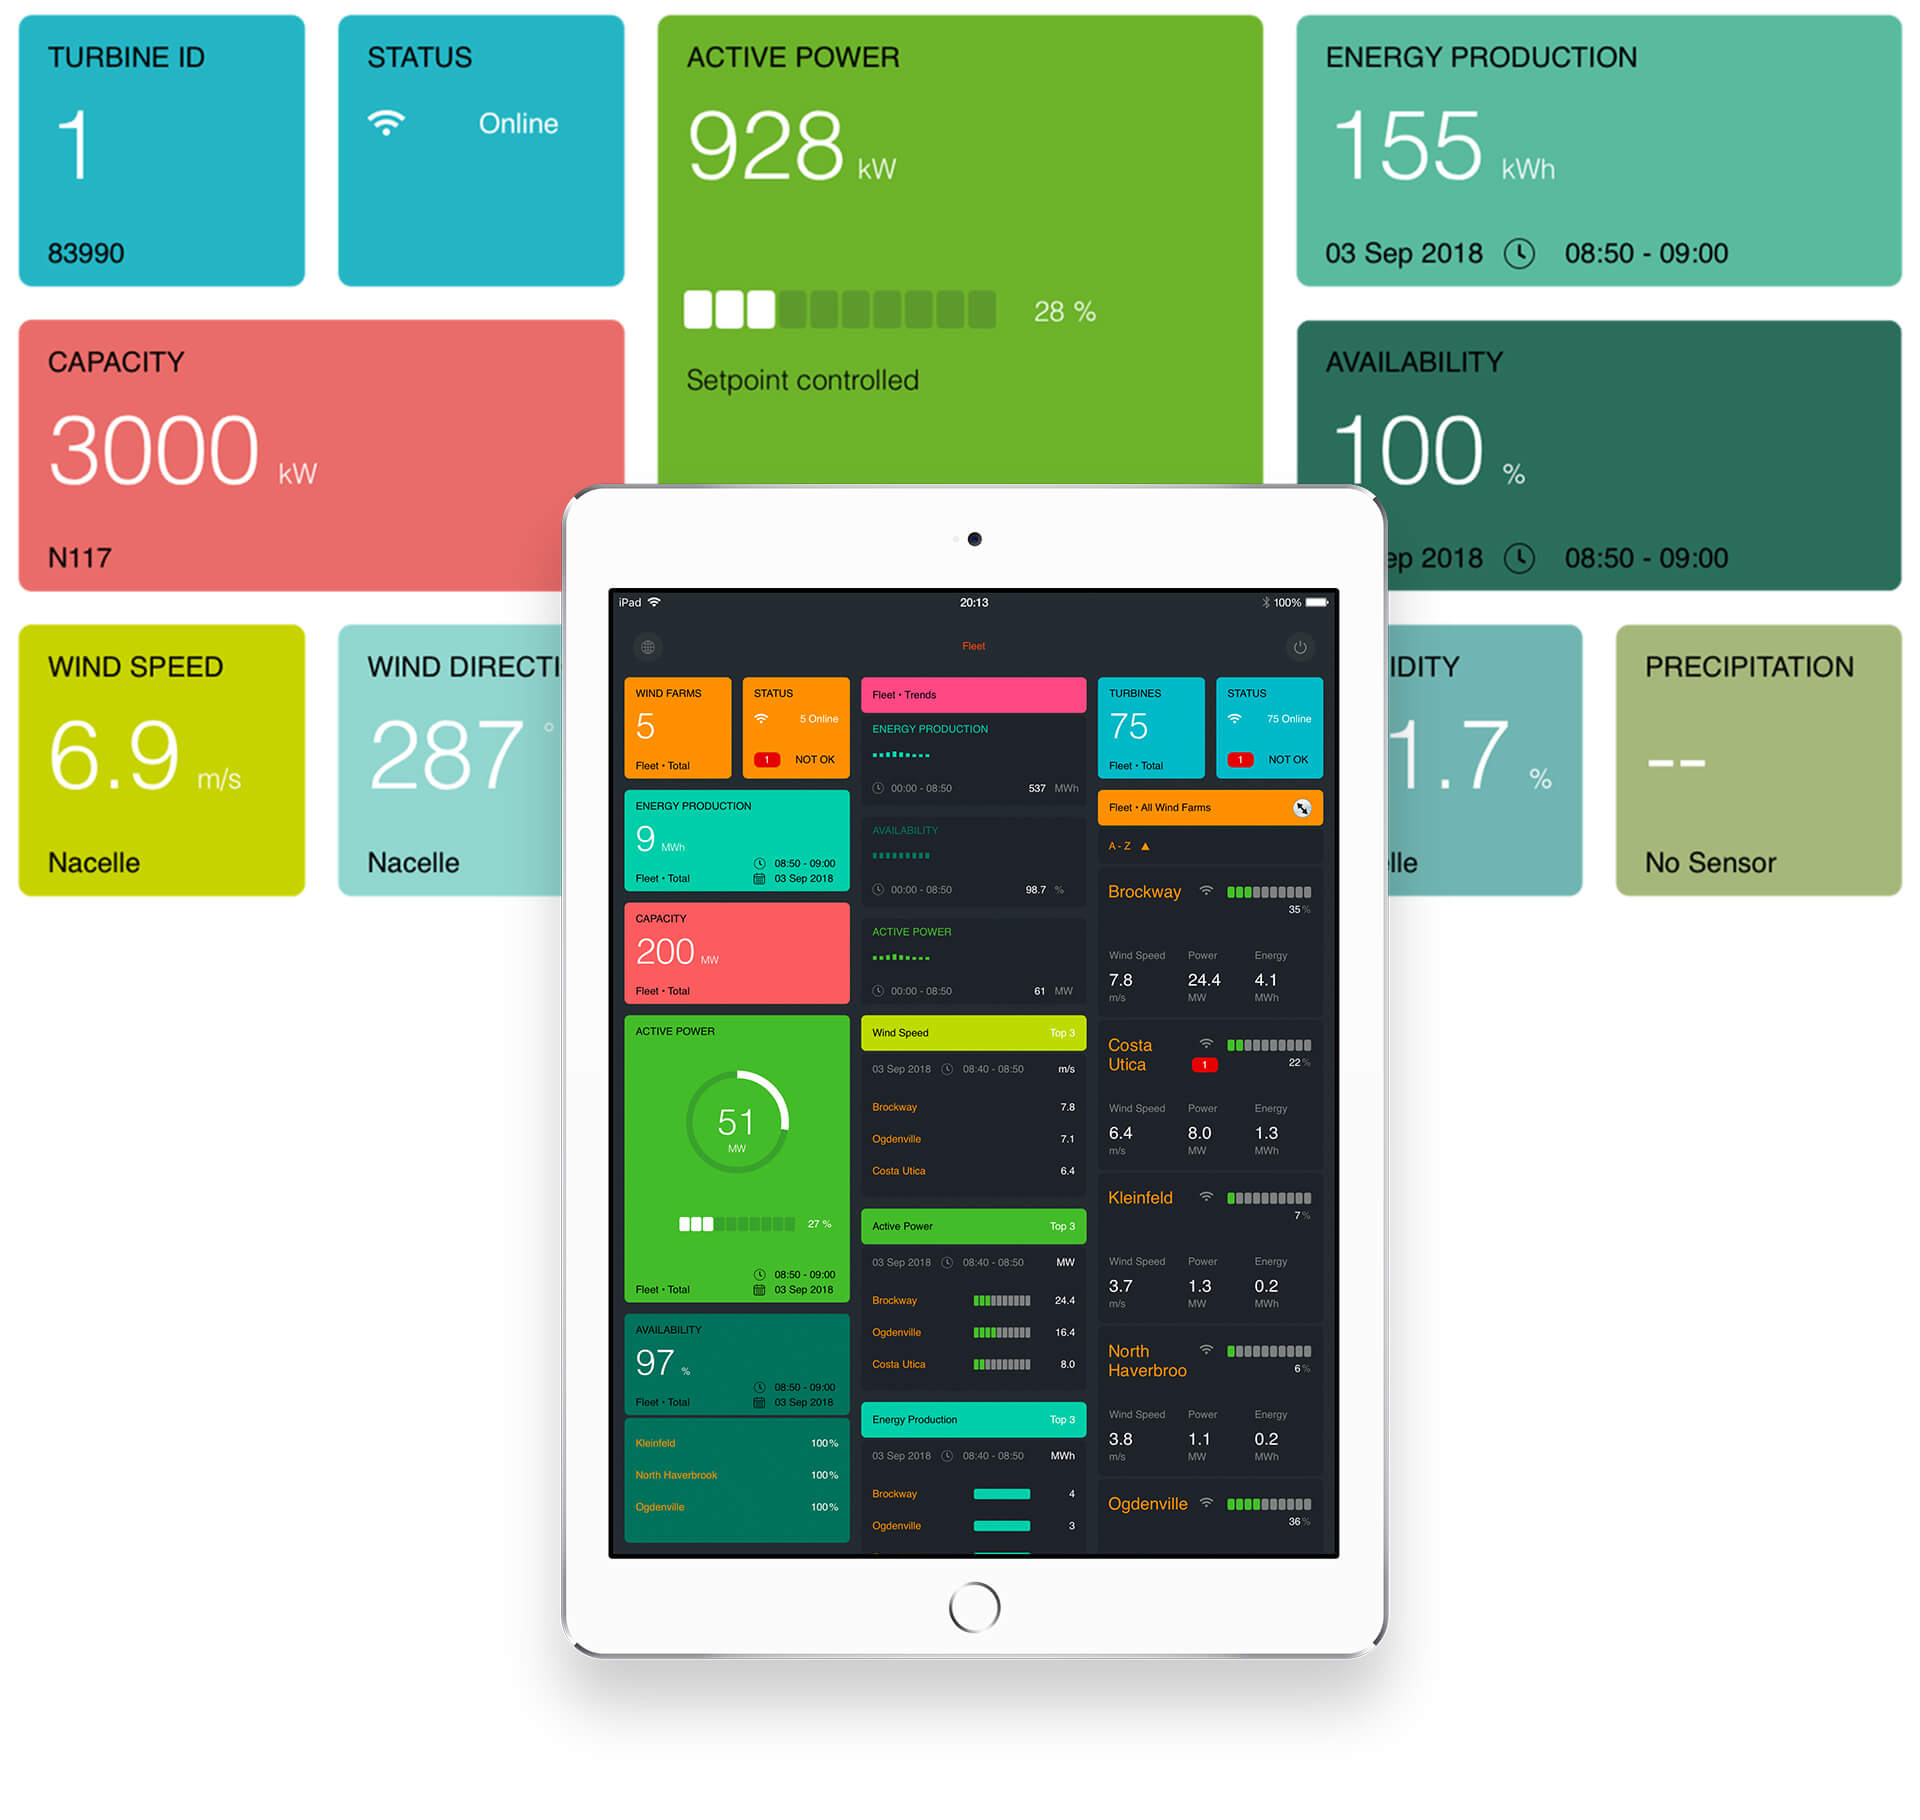
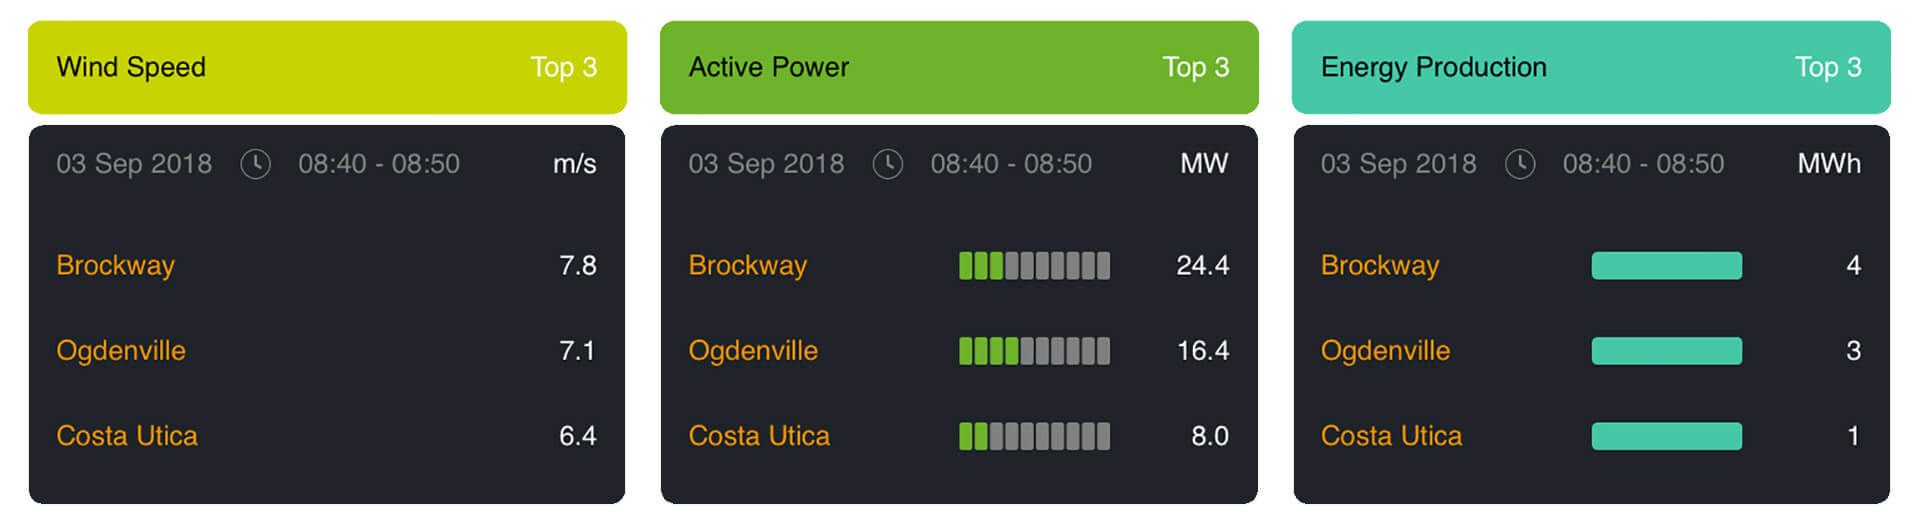
No-wait, on demand KPIs
Open the app, and your KPIs are there. Thanks to the intuitive dashboard view nothing will ever evade you on your iPad. Keep tabs on your fleet performance wherever you are. Live data informs you about energy production, capacity and setpoints, active power, availability and meteorological data. Which wind farms have the highest utilization? Are there any warnings or alarms? The three best-performing wind farms are shown in the fleet view. Information about alarms and connection status of the turbines are contained in bundled messages.
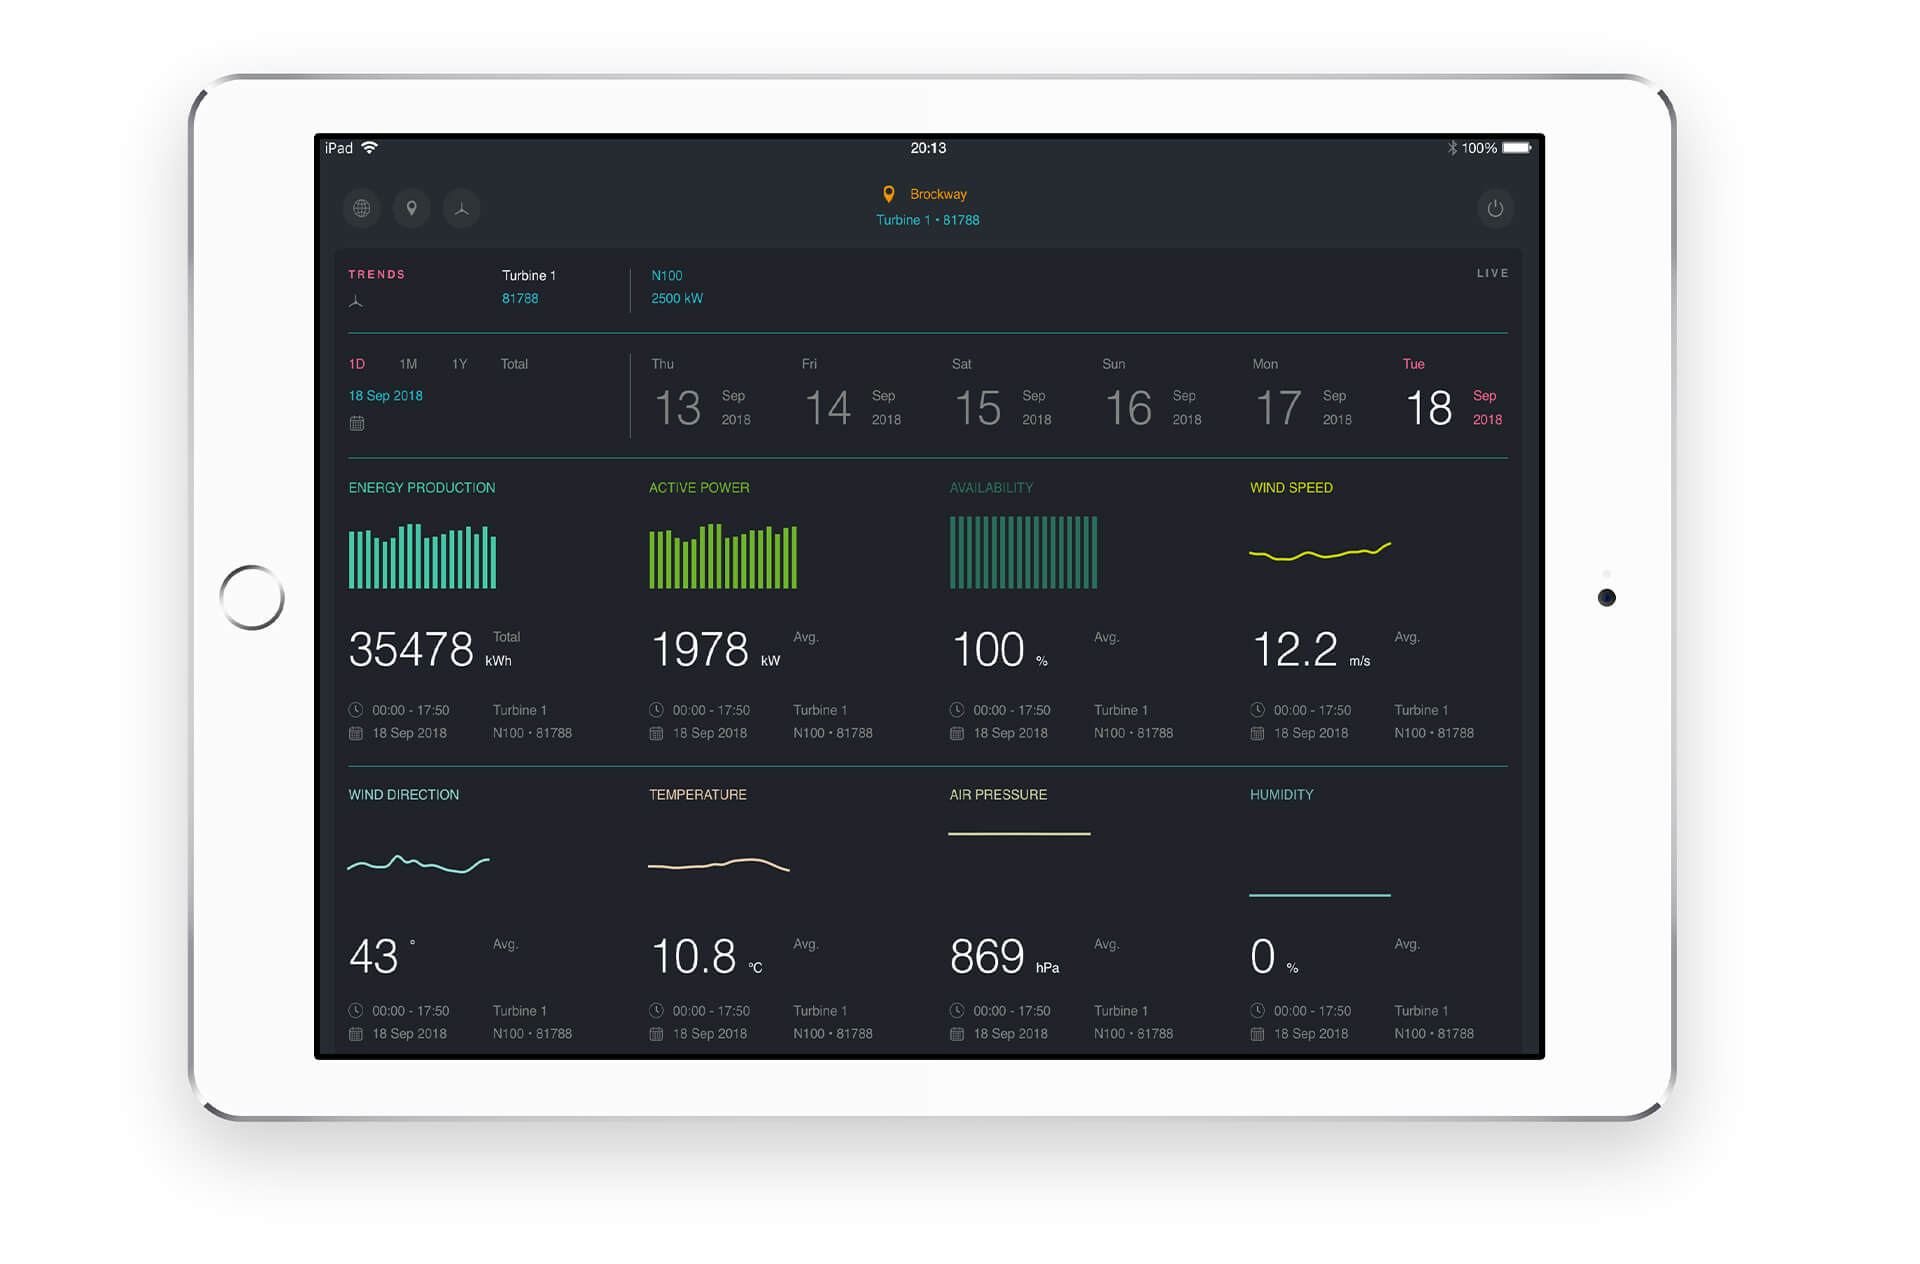
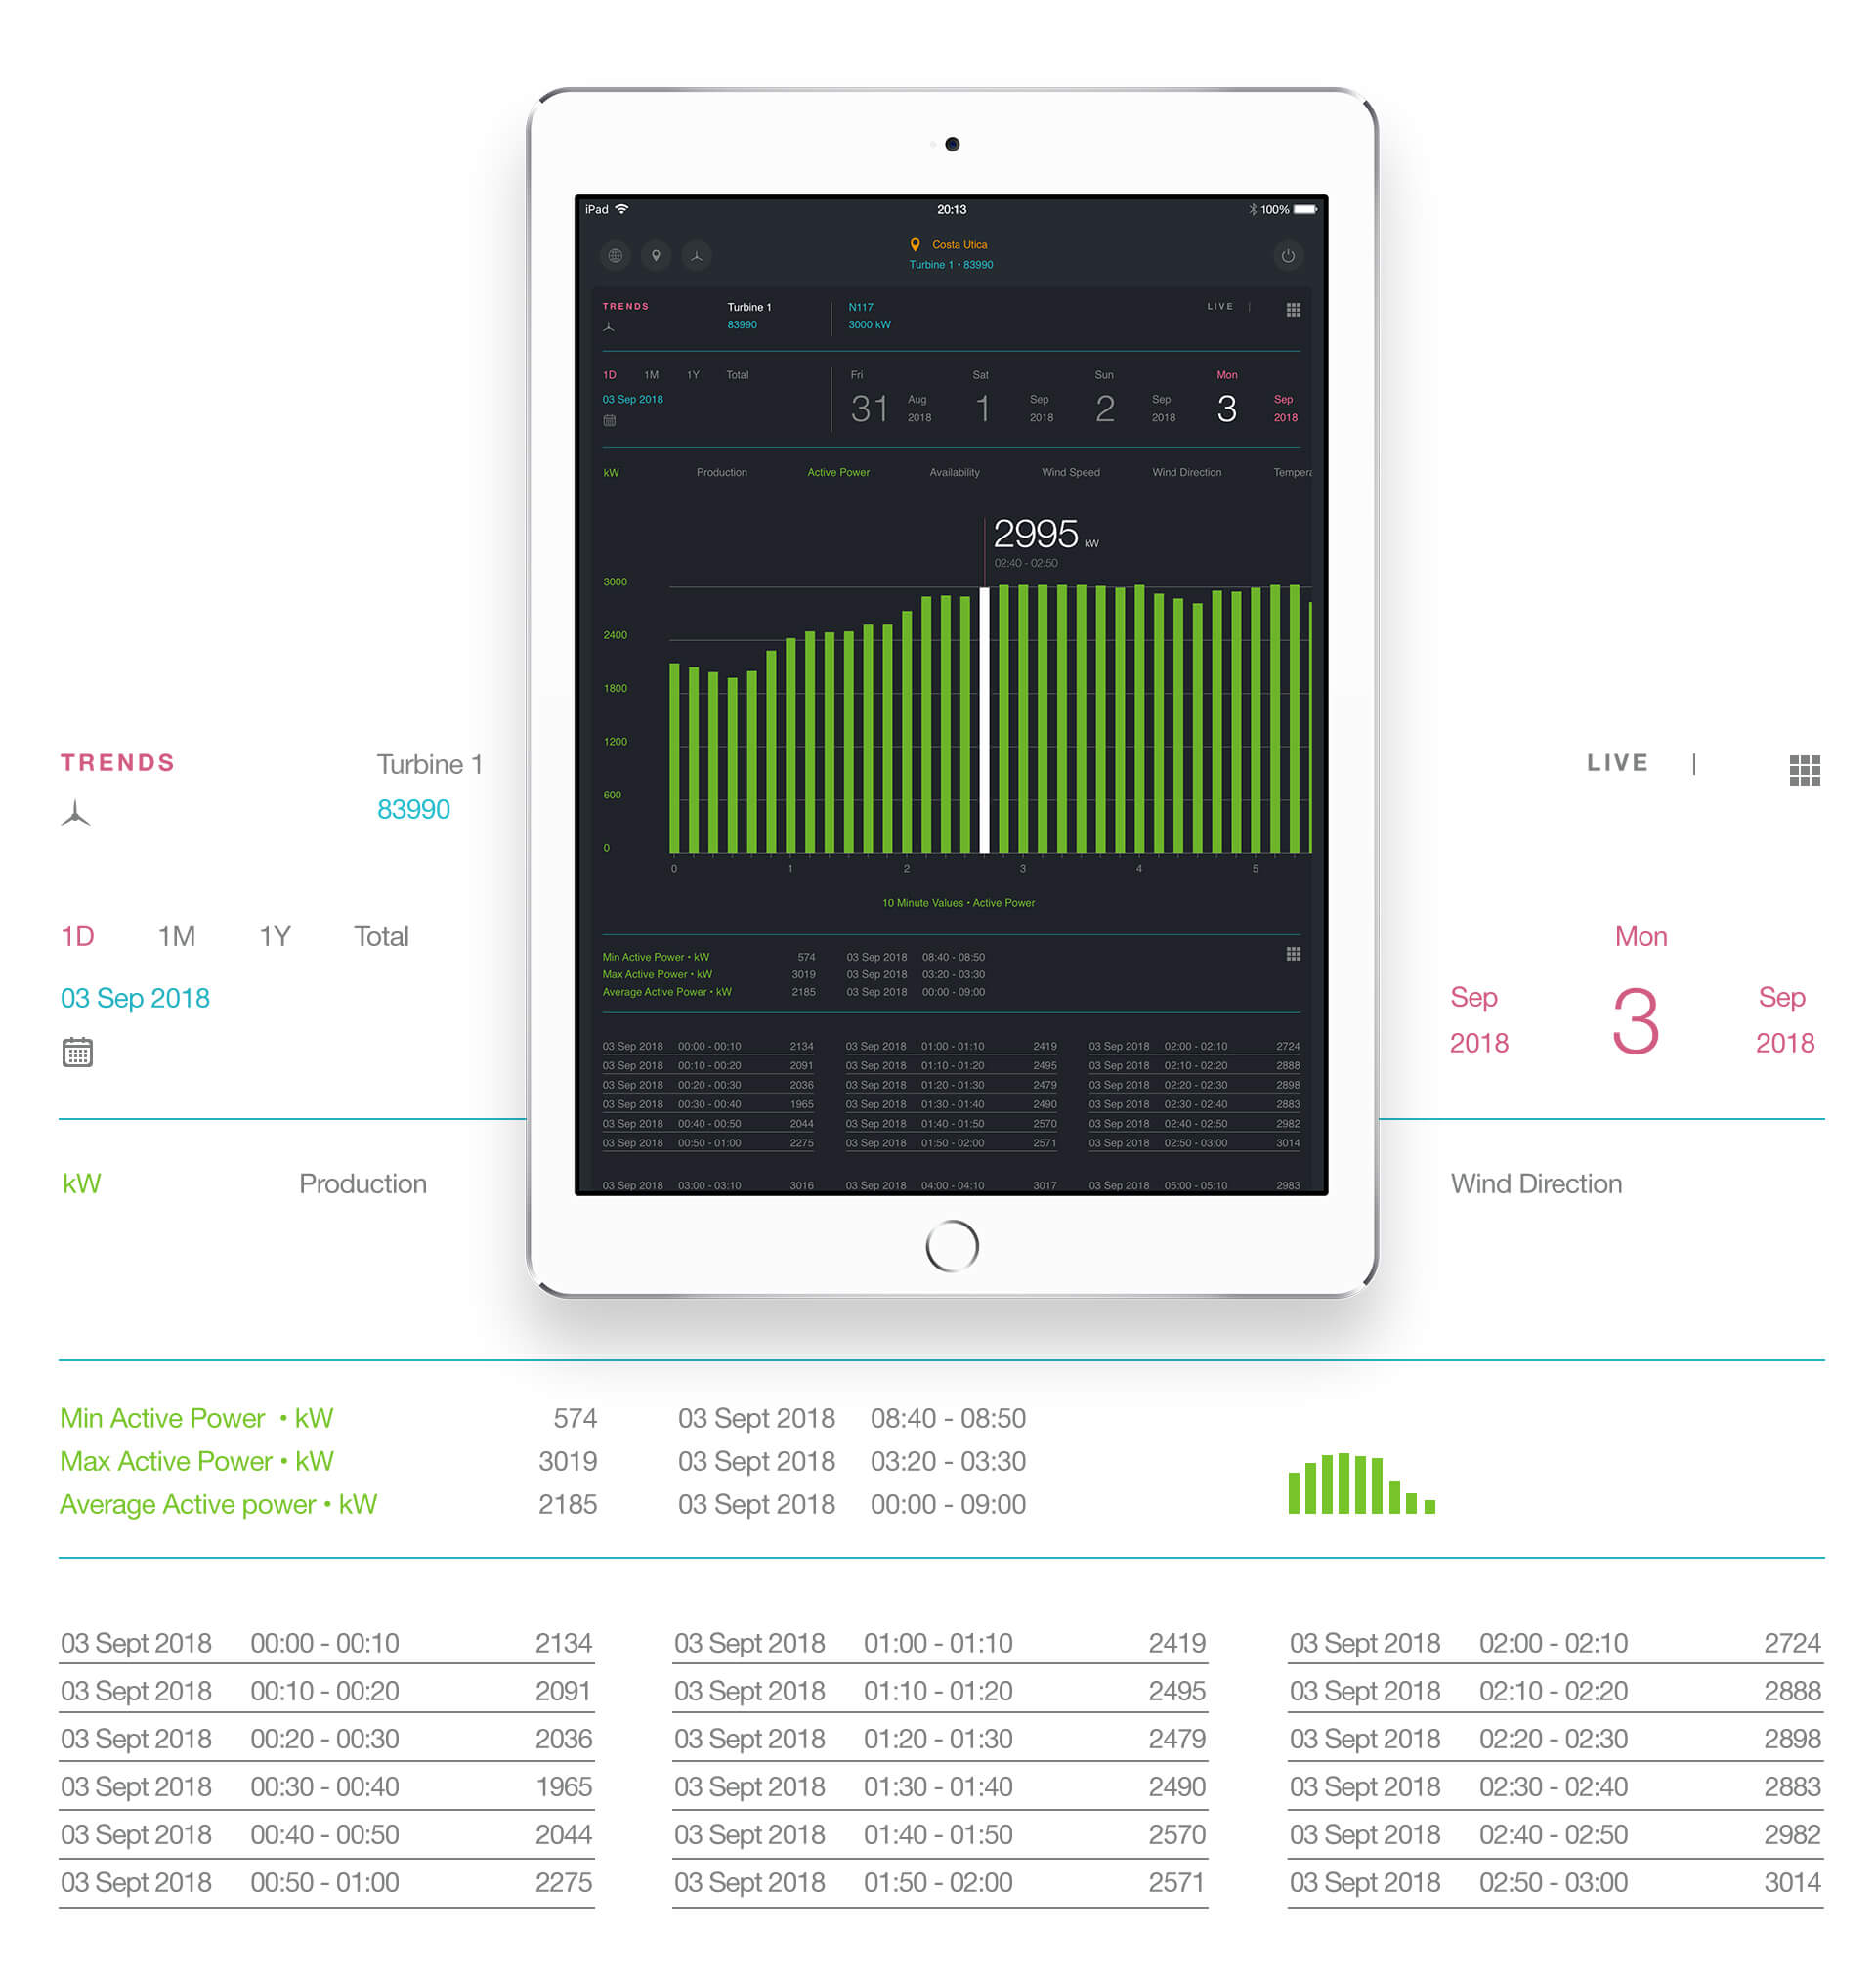
From overview to the depths of your data
Quickly navigate from the cumulative overview to detailed-information views. Effortlessly switch between wind farms and turbines within the rich performance-data level. Use the app’s consistent colour scheme to stay oriented during your KPI analysis. Want to see production trends on a daily, monthly or annual basis? Then you’re best served by picking the diagram- or table view. On any given day you can view the performance trends of your fleet, wind farm or turbines down to 10-minute granularity.